Biomedical Engineering Reference
In-Depth Information
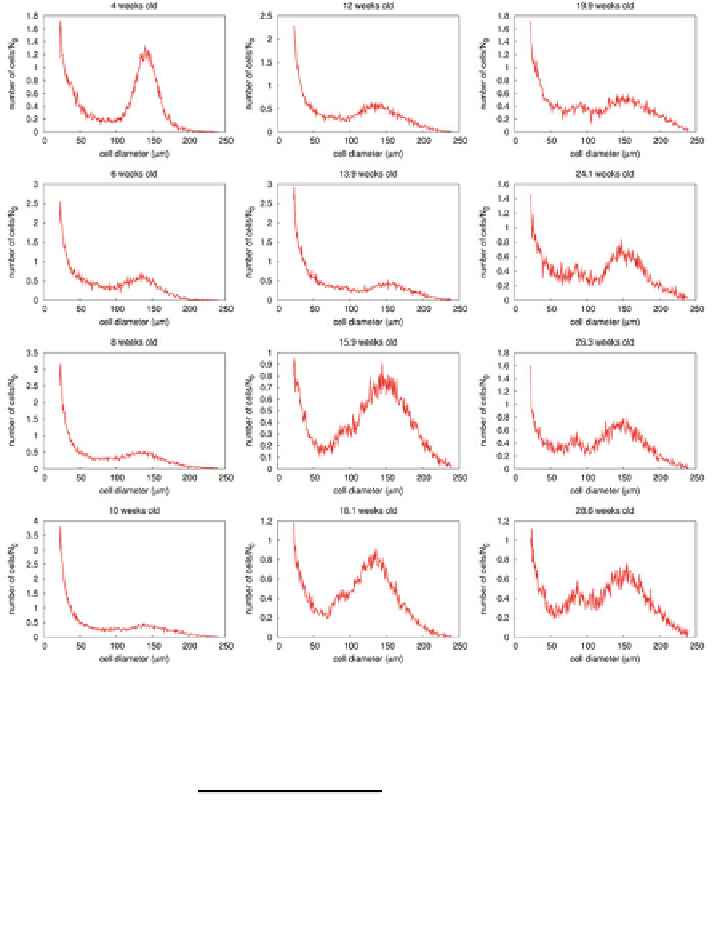
Fig. 4
Adipose cell-size distributions depending on age
1
þ
tanh
s
s
k
g
k
;
k
m
1
þ
exp
ð
a
k
ð
S
c
S
v
ÞÞ
k
ð
s
Þ
¼
ð
18
Þ
where S
v
¼
R
ds s
4
ð
s
Þ=
R
ds s
3
n
ð
s
Þ
is the volume weighted average radius, and k
m
,
a
k
, s
k
, and g
k
are kept constant. (3) The growth/shrinkage rate is defined as
r
v
tanh
s
s
þ
0
:
5s
þ
tanh
s
s
g
;
v
ð
s
;
t
Þ
¼v
m
ð
19
Þ
for a constant v
m
and r
v
¼ v
þ
=
v
m
.
Table
3
shows the E
SA
and E
PT
results for the reduced (model 2) and non-
reduced (model 1) models with g
ð
t
Þ
. The non-reduced model, model 1, shows a
better fit than the reduced model, model 2, as indicated by the E
SA
values in
Table
3
and Figs.
5
and
6
. However, model 2 is more likely as it has much lower
E
PT
values.
Search WWH ::

Custom Search