Biomedical Engineering Reference
In-Depth Information
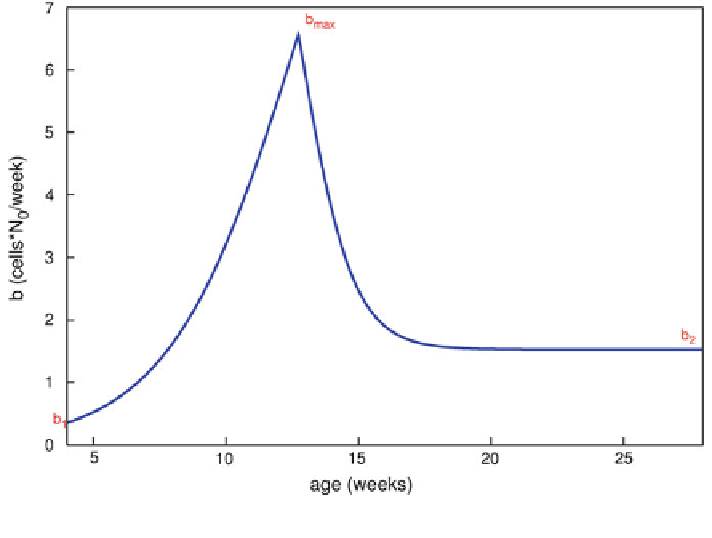
Fig. 3
Age-dependent birth rate: Here N
0
is the initial number of cells
and compare them using parallel tempering model comparison. If the aim is to
simply find the optimal values then the simulated annealing method [
31
,
32
] would
be a better option as it is much less computationally intensive than parallel tem-
pering. Global optimization methods such as simulated annealing provides us with
the cost E
SA
¼ E
ð
x
Þ
of Eq. (
2
) at the lowest energy point (i.e., at the optimal
parameters) but do not take into account the width of the energy landscape. The cost
obtained from parallel tempering is E
PT
¼
R
0
dbE
b
. Thus, a lower E
PT
implies a
higher model likelihood as can be seen from Eq. (
10
).
Tables
1
and
2
show E
SA
and E
PT
respectively for the six models fitting 14
different experimental data. The data represent cell-size distribution over time
taken from rats fed either a regular chow diet (rats 4 and 5), a high fat diet (rats 6,
7, 8), or under a TZD treatment (rats 12 and 13). At each time point two biopsies
are taken, one from the right side and another from the left side. The results show
that the most likely model is the one where the steepness of the shrinkage rate
g
vary with time (i.e., g
takes a different independent value at each time-step).
Another factor that needs to be taken into consideration is a possible correlation
between parameters. For example, after examining the correlations between all the
parameters, we were able to reduce the model with g
ð
t
Þ
as follows: (1) Parameters
b
1
and a
2
of Eq. (
17
) and the diffusion constant D are kept constant. (2) The cell
death is defined as
Search WWH ::

Custom Search