Java Reference
In-Depth Information
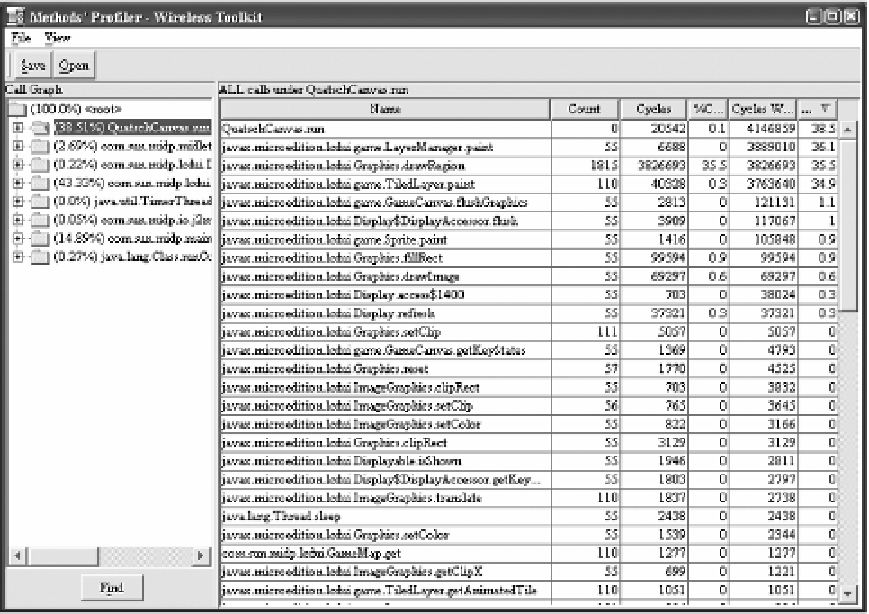
You won't see the profiler until you exit the emulator. When you do, the profiler window
pops up, summarizing time spent in every method in your application during the last emulator
run. Note that what you do in the emulator will affect the output in the profiler; if you want to
test the performance of your application as a whole, you'll have to exercise all of its options.
Figure 17-3 shows the emulator after running the
QuatschMIDlet
example from Chapter 11.
Figure 17-3.
The profiler times everything.
Finally, the J2ME Wireless Toolkit also includes a network monitor. Although it's probably
more useful for debugging network protocols than for optimization, it deserves mention here.
To turn on the network monitor, choose Edit
Preferences from the KToolbar menu. Choose
the Monitoring tab and check off Enable Network Monitoring. Next time you run the emulator,
a new window will pop up that tracks network usage. Figure 17-4 shows a few network interactions
from the PeekAndPick application (
http://developers.sun.com/techtopics/mobility/
applications/peekandpick/2.0/index.html
).
➤
Search WWH ::

Custom Search