Travel Reference
In-Depth Information
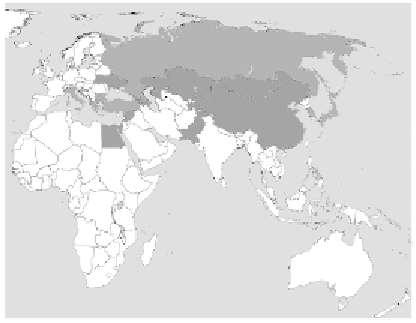
Figure 1 shows the map of the Silk Road countries after cluster analy-
sis is employed. In the map, Cluster 1 countries have been shown in dark
yellow and Cluster 2 countries in blue.
FIGURE 1
Map of clustered Silk Road countries.
One of the other aims of this analysis is to compare both clusters in
terms of T&T Competitiveness Index pillars and variables. For this pur-
pose, we employed five t-test analyzes the results of which are reported in
Tables 3-6.
RESULTS OF T-TEST FOR TRAVEL & TOURISM
COMPETITIVENESS PILLARS
The results of t-test (see Table 3) for cluster membership and Travel &
Tourism Competitiveness pillars revealed that Cluster 2 countries per-
formed better than Cluster 1 countries in ten out of 14 competitiveness
pillars, which are
policy rules and regulations
(Mean
1
= 4.04,
Mean
2
=
4.45; t = -2.530; p = 0.019),
environmental sustainability
(Mean
1
= 3.86,
Mean
2
= 4.44; t = -4,148; p = 0.002),
health and hygiene
(Mean
1
= 4.78,
Mean
2
= 6.01; t = -3.512; p = 0.002),
air transport infrastructure
(Mean
1
= 2.72, Mean
2
= 3.83; t = -4.2789; p = 0.000),
ground transport infra-
structure
(Mean
1
= 3.20, Mean
2
= 4.34; t = -3.548; p = 0.002),
tourism
infrastructure
(Mean
1
= 2.28,
Mean
2
= 4.98; t = -5.460; p = 0.000),
ICT

Search WWH ::

Custom Search