Database Reference
In-Depth Information
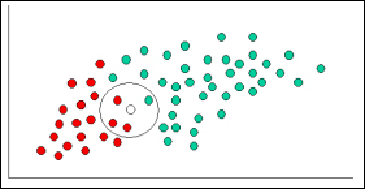
Since there are twice as many good customers (green) plotted as bad (ones in red),
it is reasonable to believe that a new customer who hasn't yet been evaluated is
twice as likely to be green rather than red. In the Bayesian analysis, this belief is
known as the prior probability. Prior probabilities are based on previous experience
and in the current example, the percentage of green and red plotted. As the word in-
dicates, it is often used to predict outcomes before they actually happen. Let us now
assume there is a total of 60 customers, with 40 of them classified as good and 20
of them as bad. Our prior probabilities for class membership are:
•
Prior probability of good customers: number of good customers (40) / total
number of customers (60)
•
Prior probability of bad customers: number of bad customers (20) / total num-
ber of customers (60)
Having formulated our prior probability, we are now ready to classify a new customer
(white circle in the following figure). We then calculate the number of points in the
circle belonging to each class label. From this we calculate the likelihood of the new
customer to be marked as good or bad.
K-means clustering
K-means clustering algorithm is considered one of the simplest unsupervised learn-
ing techniques. As a first step, the given data is classified into a set of fixed
k
clusters. Every cluster would have its own centroid placed carefully and away from
each other. As a next step, a unique point in a cluster is associated to the nearest
centroid. This exercise is done until all the points identified are exhausted.
Based on these associations, new centroids are identified. A repeat of the preceding
exercise is done until no changes or movements in the centroids are identified. Fin-
Search WWH ::

Custom Search