Chemistry Reference
In-Depth Information
buffer, resulted in a
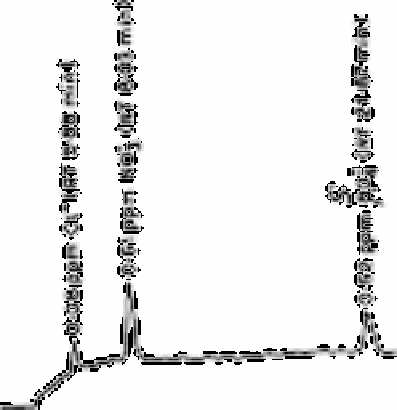
Fig. 12.30
Ion chromatogram of rainwater sample with relatively low
concentrations of Cl
−
, NO
3
−
and SO
4
2−
Source: Reproduced with permission from the Journal of
Oceanographic Science [61]
large drop in the baseline as the sample front entered the conductivity cell. At a
recommended eluent buffer concentration of 4m mol L
−1
potassium hydrogen phthalate
(pH 4.5) as suggested by the manufacturer, the chloride and nitrate peaks were on an
upward sloping baseline, which prevented accurate determination of the peak area with
the reporting integrator. The sulphate peak, whose retention time was much longer than
that of the other two anions, always exhibited a baseline suitable for accurate
quantitation. The chloride and nitrate peaks were shifted from the sloping portion of the
baseline by a reduction in the concentration of the eluent buffer. Reduction in buffer
concentration increased the retention time of all the anion peaks. All peaks also
experienced broadening and, in the case of sulphate, this was significant enough to limit
the reduction in buffer concentration to 2m mol L
−1
potassium hydrogen phthalate (pH
4.5). At this concentration the chloride and nitrate peaks were shifted from the sloping
baseline for more accurate quantitation, while the sulphate peak had not broadened to the
point where detection sensitivity was too greatly diminished.
To test the precision of this method, the calibration standard was diluted 1:2, 1:4 and
1:8. The standard and each dilution were then analysed for anions. The results are
summarised in Table 12.13. To verify that detection response was linear for each anion in
the concentration range desired for these studies, graphs of peak area vs concentration
were prepared.
Search WWH ::

Custom Search