Chemistry Reference
In-Depth Information
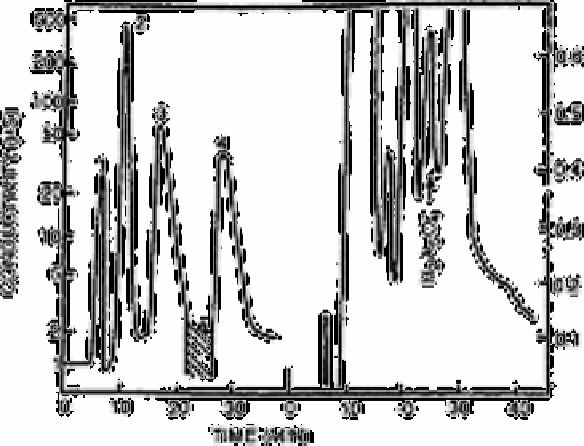
Figs. 12.13-12.15 show representative chromatograms for each of the trace anions at
close to the statistical detection limit. The initial injection is shown on a logarithmic scale
of conductance to include complete peaks of the major constituents. The recycle portion
of the chromatogram was obtained at the linear scale, usually 1µs cm
−1
full scale
sensitivity. Fig. 12.14 shows a second collection and recycling of selenite. The process
can be repeated indefinitely but there is evidence (below) of 10-15% loss of material
each time.
Fig. 12.15
Arsenate in river water: sample size 5ml, 50ng of As(V) added—
major peaks: (1) fluoride; (2) chloride; (3) nitrate; (4) sulphate.
Shaded area was collected for recycle
Source: Reproduced with permission from the American Chemical
Society [22]
Calibration curves for each trace ion in each matrix are summarised in Table 12.7.
Amounts of trace anion injected were run in a randomised order and most calibrations
included both 2ml and 5ml initial injections. Increasing the sample size allows lower
concentrations of the minor constituent to be collected but does not affect the relative
proportions that must be separated. Variation of sample sizes between 0.1 and 5ml did
not affect mass detection limits.
The detection limits shown in Table 12.7 are all 3σ (ie 3×standard deviation) limits
based on the standard deviation of the ordinates from the least squares linear fit. In all
cases this limit is appreciably greater than the detectability of trace amounts in individual
runs, as shown in Figs. 12.13-12.15.
One effect of the matrix water on trace determination is the concentration of major ion
interference. In the case of selenite, the major interferent is nitrate and the exceptional
results in river water may be related to the high nitrate level in that medium. If that were
Search WWH ::

Custom Search