Chemistry Reference
In-Depth Information
Source: Reproduced with permission from the Water Research Centre,
UK [11]
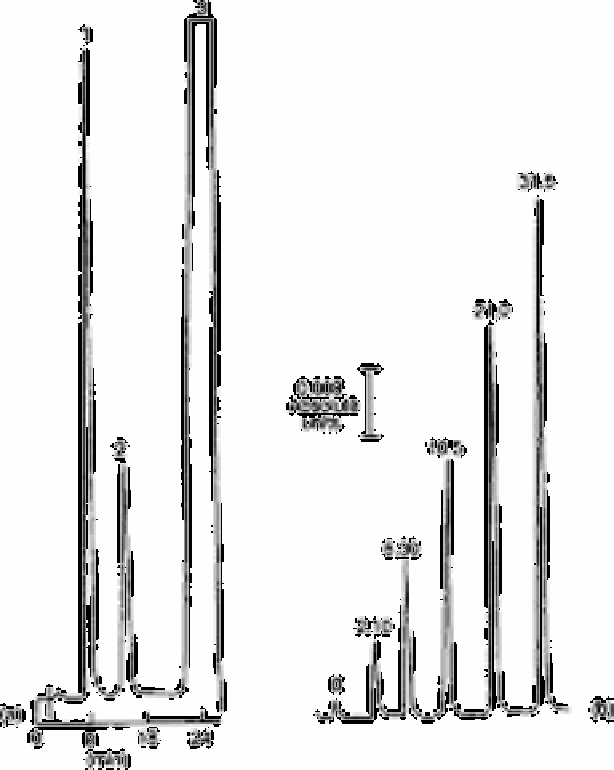
Fig. 9.3
Sample chromatogram of a 42 ppm phosphate sample. Absorbance
units full scale, au.f.s.=0.08. Peaks: 1=hypoxanthine; 2=m-
aminophenol; 3=inosine. (b) Hypoxanthine peak for various
phosphate concentrations in mg L
−1
(indicated above each peak)
Source: Reproduced with permission from Elsevier Science [15]
The inosine and hypoxanthine were separated by reversed phase high performance liquid
chromatography and the amount of hypoxanthine produced was related to the phosphate
concentration. Quantitation of the hypoxanthine peak was found to be linear with
orthophosphate up to about 30mg L
−1
. A detection limit of 0.75mg L
−1
could be obtained
after dialysis of the commercial enzyme. Interference studies showed that the enzymatic
Search WWH ::

Custom Search