Chemistry Reference
In-Depth Information
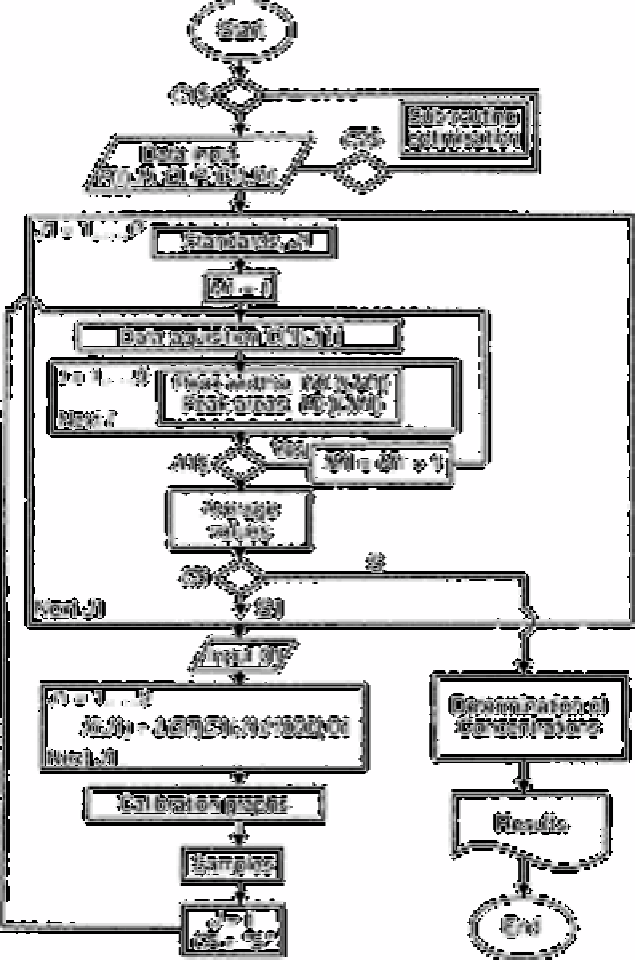
Fig. 7.4
Flow diagram of the computer program, Cl%=inquiries to the program;
P(I) measurement height; N=number of absorbance-time data points;
Q=interval between two consecutive data points; P=number of
standards; Cl (JI)=concentration of standards; C(I)=concentration of
analyte; t(I)=time;WO=peak width;VO=peak area; 01=molecular
mass; S=sample; SI=standard and JI, MI and I=counters
Search WWH ::

Custom Search