Chemistry Reference
In-Depth Information
concentration increases so that well-formed peaks will result. Thus an analysis can be
successfully performed by this technique with a sample concentration in the zone of the
reagent that is typically in the range from 67% to 90% of the sample concentration in the
carrier stream.
Johnson and Petty [179] adapted reverse flow injection analysis to the well-known
Murphy and Riley [180] colorimetric phosphomolybdate reduction method for the
determination of phosphate.
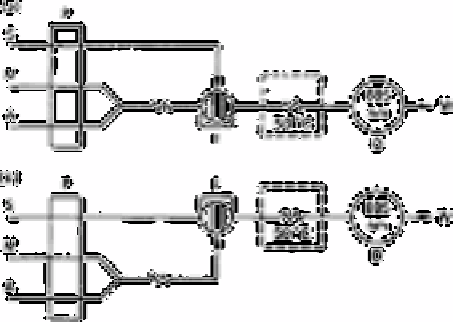
Fig. 3.16 shows flow sheets for the determination of phosphate by flow injection
analysis and reversed flow injection analysis. A block diagram of the apparatus used for
the determination of phosphate in seawater is shown in Fig. 3.16(b).
The effects of residence time on the peak height of a 2.5µmol L
−1
phosphate standard
are shown in Fig. 3.17. The residence time was defined as the time from injection of the
reagent to appearance of the maximum signal at the detector. Residence times were
varied by
Fig. 3.16
Analytical manifolds for the determination of phosphate by flow
injection analysis (a) and reverse flow injection analysis (b). The
symbols S, M and A are the seawater, mixed reagent and the ascorbic
acid solutions. The pump, injection valve and detector are
represented by P, I and D respectively. W=waste
Source: Reproduced with permission from the American Chemical
Society [179]
changing the flow rate (1.0-3.5ml min
−1
in 0.5ml min−
1
increments) and the length of the
reaction tube (0.5, 1.0 and 1.5m). The peak height increased rapidly with residence time
in both 0.5 and 0.8mm id tubes and then levelled off after 15s. The change is about the
same when the residence time is increased by using longer tubes. This suggests the
increased peak height is due mainly to an increased extent of reaction.
3.24.3
Ion chromatography
Tyree and Bynum [136] have described an ion-chromatographic method for the
Search WWH ::

Custom Search