Chemistry Reference
In-Depth Information
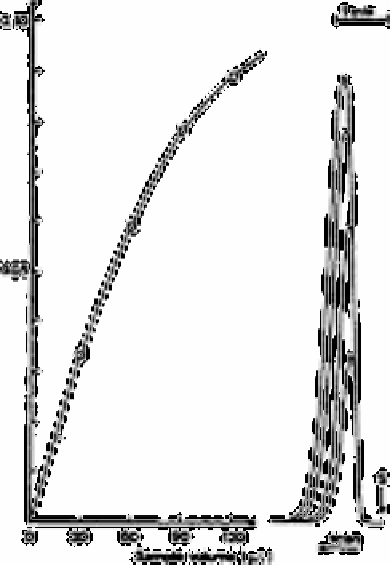
Fig. 3.13
Response curves obtained by injecting different sample volumes of a
1µM nitrite standard
Source: Reproduced with permission from Elsevier Science [130]
Peaks obtained by injecting different sample volumes of a 1µM nitrite standard are
shown in Fig. 3.13. The optimum sample volume is of the order of 100µL. Peak
broadening is due to mixing the in the manifold.
The spectrophotometric signal is due not only to the absorbance but also to the
refraction of the sample. Refraction is of no practical importance at absorbance values
above 0.05. The detection limit is determined by the difference in refraction between the
reagent stream and the sample. Thus, in order to achieve low detection limits—0.05µM
for nitrite and 0.1µM for nitrate—it was necessary to adjust the refractive index of the
reagents to a value as close as possible to those of the samples. For seawater analysis, this
was achieved by adding sodium chloride to the reagents. This also improved the
reproducibility of dispersion because density differences were found to cause turbulence.
In the analysis of sea water, the only significant interference arises from turbidity
caused by particles in the sample. Prior filtration of the sample is therefore necessary. For
anoxic waters, however, sulphide concentrations over 2µM were found to decrease the
absorbance. This was overcome by adding an excess of either Cd
2
+ or Hg
2+
to the sample
[160,161],
Search WWH ::

Custom Search