Chemistry Reference
In-Depth Information
detection limit is 112mol L
−1
and precision is better than 1% at concentrations greater
than 10µmol L−1.
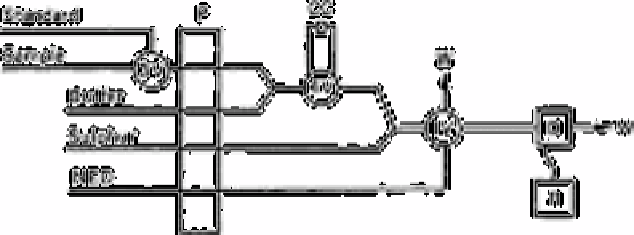
Fig. 3.8
Block diagram of the apparatus used to determine nitrate and nitrite.
P=Pump; CC=cadmium reduction column; 3V=three-way valve used
to switch between the sample and the standard; 4V=switching valve
used to take the cadmium column out of line; IV=injection valve;
D=detector;W=waste; R=recorder; Sulf. and NED are the
sulphanilamide and N-(1 naphthyl)ethylenediamine dihydrochloride
reagents
Source: Reproduced with permission from Springer-Verlag [133]
A block diagram of the equipment used is shown in Fig. 3.8. The reaction manifold was
made from 0.8mm id. PTFE tubing. A four-channel Buchler peristaltic pump was used to
propel the seawater and reagents. Tygon pump tubes (1.6mm id) were used to pump the
sample (seawater or standard) and the ammonium chloride buffer. The sulphanilamide
and diamine reagents were pumped with 0.8mm id Tygon tubing. The flow rates of these
reagents were 4.5 times smaller than the sample and buffer flow rates. Altex low pressure
fittings were used to make all of the connections between pump and manifold tubing and
at the T fittings.
All of the tubing in which the sample was carried from the inlet, through the pump and
reduction column to the confluence with the sulphanilamide line was made as short as
possible.
The reduction column consisted of a piece of copperised cadmium, 1cm long in a piece
of PTFE tubing 3cm long and 3.2mm id (¼in.). Glass wool plugs (3mm long) were
placed in each end to retain the cadmium powder and were in turn held in place by short
pieces of PTFE tubing (1.6mm id, 3.2mm od). Connections to the reaction manifold
tubing (1.6mm od) were simply press fit into these adapters until the ends were flush.
The peaks obtained for a series of standard solutions are shown in Fig. 3.9. A small
amount of carryover between samples, amounting to about 1%, is evident. A calibration
curve obtained from these standards is distinctly non-linear; errors in accuracy, under 1%,
appear at concentrations above 10µmol L
−1
if a linear calibration is assumed.
Fig. 3.10 shows distributions of nitrate determined by this method and chlorophyll and
water temperature in a sea cruise over a thermal front. The concentrations of nitrate
changed by nearly an order of magnitude within a few minutes; these changes are highly
Search WWH ::

Custom Search