Chemistry Reference
In-Depth Information
magnitude greater than those normally occurring in seawater [69]. This observation is
noteworthy, since the work of Liberti and Mascini [66] suggests that the direct method
cannot be used for fluoride in the presence of high relative concentrations of aluminium
(III) or iron(III) aquo species.
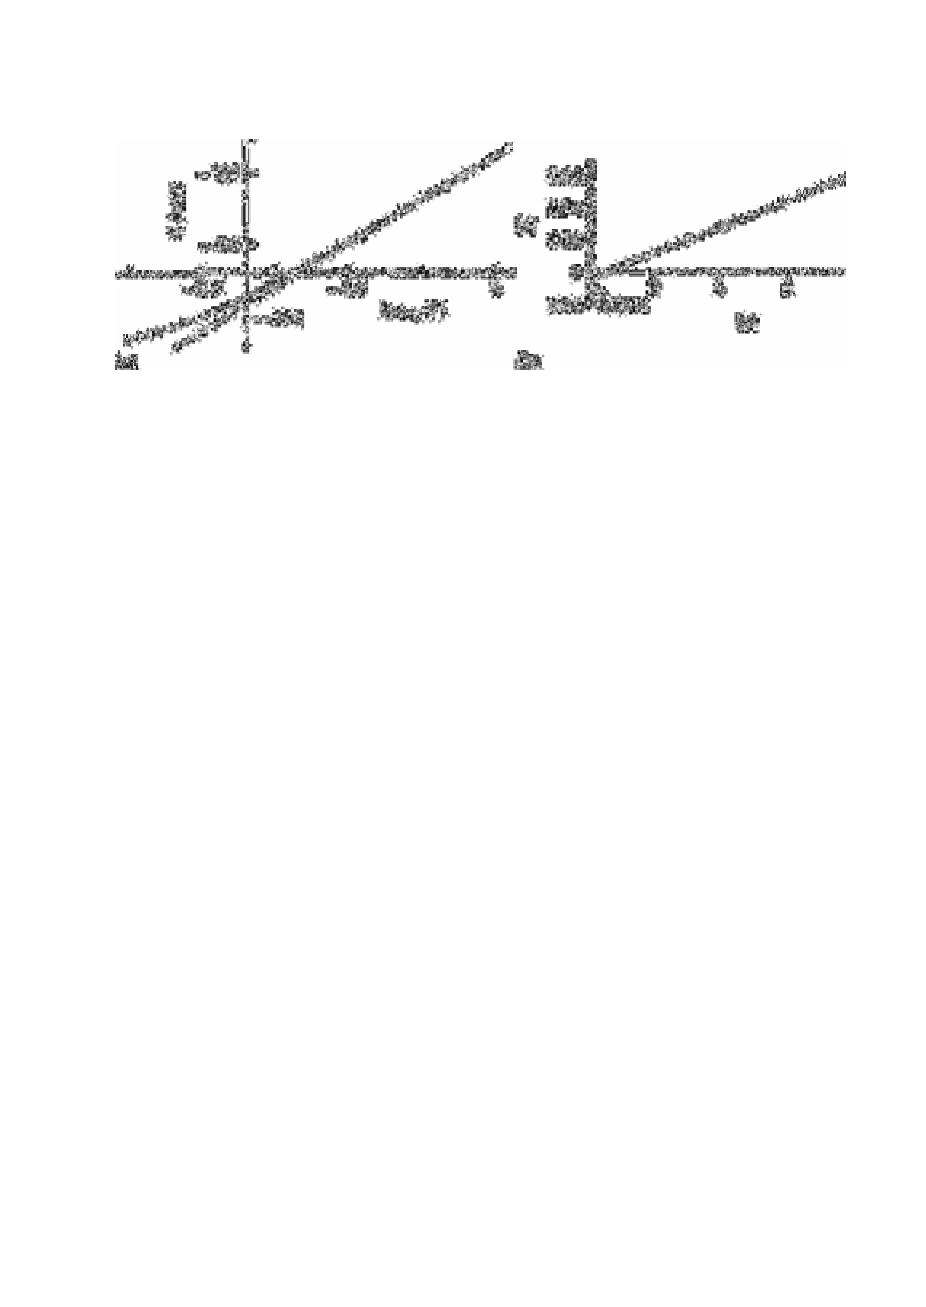
Fig. 3.4
(a) Plot of emf versus log (F
−
) for data obtained from synthetic
seawater sample. (b) Plot of z versus y for data in (a) showing the
linear extrapolation
Source: Reproduced with permission from the American Chemical
Society [60]
This complication is probably avoided in seawater (even with relatively high
concentrations of aluminium(III) and iron(III)) by the large excess of chloride ions which
partially complex with any aluminium(III) or iron(III) present to produce chloro-
complexes of the metals, thus sequestering their influence on the fluoride concentration.
Data obtained after addition of TISAB to release bound fluoride and using the calibration
method further confirm the validity of the direct method. The data in Table 3.6
demonstrate the absence of hydroxide ion interference caused by metal ion complexation
and indicate that total rather than free fluoride is determined by the method of standard
additions. Fig. 3.4(a) shows a plot of potential versus the logarithm of the concentration
of added fluoride in synthetic seawater. The slope of the linear portion of the graph was
58.8mV per decade change in fluoride ion concentration, and this value was used in the
calculations of fluoride concentration in seawater. At lower levels of fluoride (<10
−6
mol
L
−1
), it might be assumed that the electrode behaves in a non-Nernstian fashion.
However, calculations of the kind suggested by Rix
et al.
[60] reveal that the deviation
from linearity can satisfactorily be attributed to residual fluoride resulting either from
reagent contamination or from the electrode itself at a concentration of about 3×10
−7
mol
L
−1
.
The level of fluoride in seawater is at least two orders of magnitude higher than this
residual level, hence contamination does not significantly influence the results.
When handling large numbers of samples, computerised rather than graphical analysis
is considered to be substantially superior. The precision of the data reported in Table 3.6
is largely limited by the accuracy of the potential measurement (±1mV). Using
instrumentation capable of measuring 0.1mV and with least-square fitting of data,
average deviations on replicate determinations were routinely found to be 2%.
Search WWH ::

Custom Search