Chemistry Reference
In-Depth Information
concentration
Parameter
Detection method
Range of
determination
a
Equation of
calibration
graph
b
Regression
coefficient
RSd, %
concentration
pH
Potentiometric
(continuous
control)
3-11
Alkalinity
Spectrophotometric ∆
t:
5.0-600µg
ml
−1
CaCo
3
∆
S:
10.0-
600µm mL
−1
CaCo
3
∆
t
=31.28
log C+151.5
∆
S
=3.48 log
C+17.3
0.9952
0.9965
±1.5(11.9µg
mL
−1
)
±1.7(11.9µg
mL
−1
)
Concentration Spectrophotometric 0.7-2.8 mequiv
L3
−1
Cl
−
2.8-2.7 mequiv
L
−1
Cl
−
∆
t
=3.09 log
C+9.4
∆
t
=34.43 log
C+109.3
∆
s
=2.53 log
C+7.4
0.9998
0.9994
0.9790
±3.4 (7.04
mequiv L
−1
)
±2.1 (7.04
mequiv L
−1
)
±3.5 (7.04
mequiv L
−1
)
a
∆
t
=peak width/s
∆
S
=peak area covered by the base line and the measured height
b
C=analyte concentration
Source: Reproduced with permission from the Royal Society of Chemistry [155]
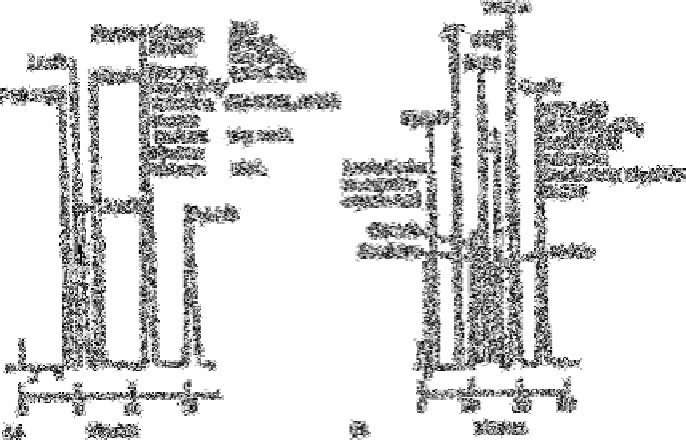
Fig. 2.11
Ion chromatograms obtained with Dionex instrument using (anodic)


Search WWH ::

Custom Search