Chemistry Reference
In-Depth Information
Fig. 2.2 (a)
Calibration peaks obtained with 10cm
2
buffer solution diluted to
100cm
3
with distilled water. The values on top of the peaks represent
mg L
−1
bicarbonate ions, (b) Corresponding calibration graph
Source: Reproduced with permission from United Trades Press [22]
In Table 2.1 a comparison is made of results obtained by the above flow injection
method, by an electrometric titration method, and by an automated bromocresol green
indicator method.
Flow injection results compare favourably with a standard electrometric method and in
some instances better results were obtained when compared to the automated
bromocresol green method. This is probably due to colour interferences from these water
specific samples. Students' t-test was applied in comparing both sets of results with the
manual electrometric method. Table 2.1 reflects these calculations. Both procedures give
results that differ to a statistically insignificant extent when compared to the electrometric
procedure. However, the difference between the procedures is smaller than the difference
between the continuous flow procedure and the electrometric procedure.
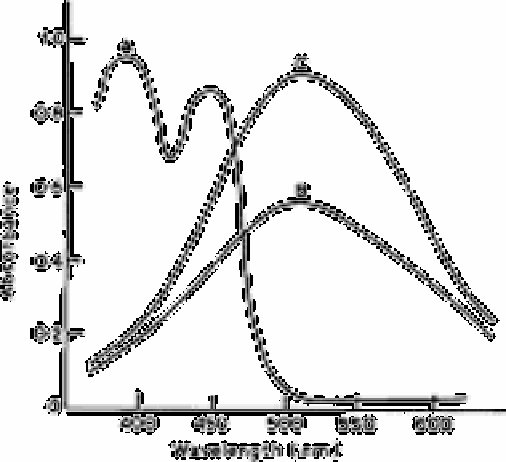
Fig. 2.3
Absorption spectra of A, reagent blank solution measured against
TBMK as reference; B, boron-curcumin compound against reagent
blank, 3µg mL
−1
of boron; and C, as B, 5µg mL
−1
of boron
Source: Reproduced with permission from the Royal Society of
Chemistry [23]
2.8.4
Ion chromatography
This technique has been applied to the determination of bicarbonate in non saline waters
Search WWH ::

Custom Search