Information Technology Reference
In-Depth Information
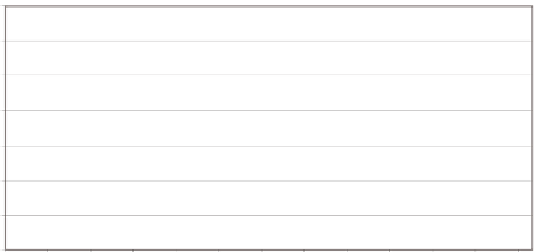
Figure 7. Demand for Sawmill and woodworking machinery man. cat
Demand for Sawmill and woodworking machinery
manufacturing category
80000
70000
60000
50000
40000
30000
20000
10000
Month and Year
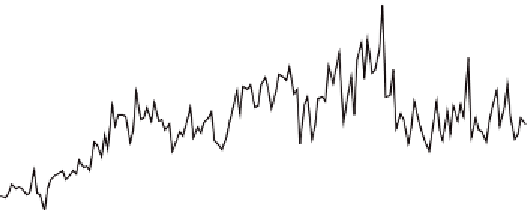
Figure 8. Demand for Urethane and other … man. cat
Demand for Urethane and other foam product (except
polystyrene) manufacturing category
80000
70000
60000
50000
40000
30000
20000
10000
Month and Year
included the manufacturers' monthly new orders by North American Industry Classification System
(NAICS) referred to as table 304-0014 (Statistics Canada, 2005). This dataset provided a good way to
experiment on a variety of demand patterns across a large number of industries (214 industrial catego-
ries). We used the most recent “new order” observations representing 12 years and 4 months of data or
148 periods. To be consistent with the other two datasets we randomly selected one hundred categories
(Appendix A). Two examples of the data series are presented in Figure 7 and Figure 8.
The patterns in the Statistics Canada data are different from those of the individual manufactur-
ers because of their aggregate nature and lengthy data collection time span. Variability is much lower


Search WWH ::

Custom Search