Information Technology Reference
In-Depth Information
Figure 2. Average cost saved vs. probability threshold
cost saVed wit h 2-gr aM(90 10)
00
000
00
COST PER SESSION
COST PER SESSION WITH
-GM
COST SAVED PER SESSION WITH
00
-GM
00
00
0
0. 0. 0. 0. 0. 0.0 0.0 0.0 0.0 0.0 0.00 0.00 0.00 0.00 0.00
Pr oBaBil it y t hr eshol d
Figure 3. Percentage of average cost saved vs. probability threshold
Per c ent ag e c o st s aVed WITh 2-g r aM(90:10)
0
0
0
COST SAVED %
0
0
0
0.
0.
0.
0.
0.
0.0
0.0
0.0
0.0
0.0 0.00 0.00 0.00 0.00 0.00
Pro BaBilit y t hr esho l d
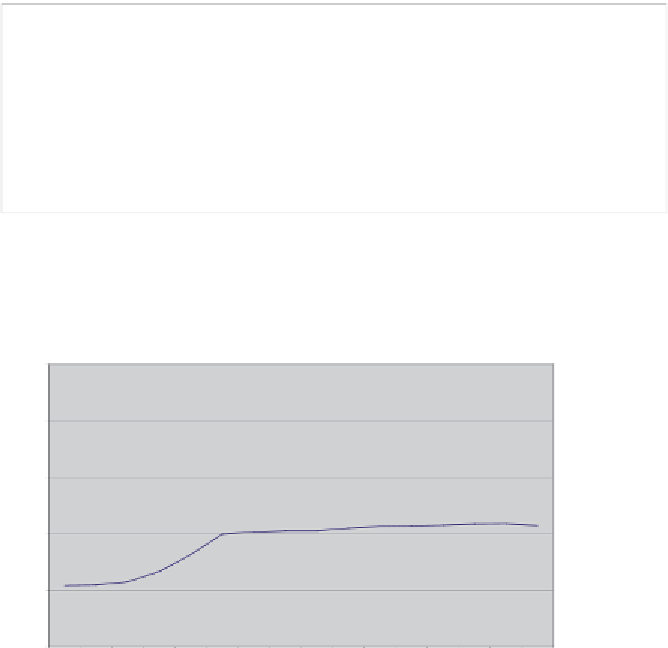
Figure 4. Percentage of average cost saved vs. depth bound
Per c ent ag e c o st s aVed WITh 2-gr aM(90:10)
0
0
0
COST SAVED %
0
0
0
0
0
dePt h Bo und


Search WWH ::

Custom Search