Information Technology Reference
In-Depth Information
by the standard deviation of the cross correlation. If it exceeds this critical value, the null hypothesis is
rejected and it is said to be significant. Since the standard deviation of the cross correlation is usually
not known a priori the critical test value is replaced by the following estimate (Bartlett, 1955):
1
∆
=
X Y
t
,
( )
n
− ∆
t
Where
n
stands for the number of samples in the time series of
X
and
Y
, respectively.
By increasing the time lag ∆
t
by discrete steps beginning at a lag of zero time periods, it is possible
to identify the minimum time lag by recording the first significant cross correlation between the time
series.
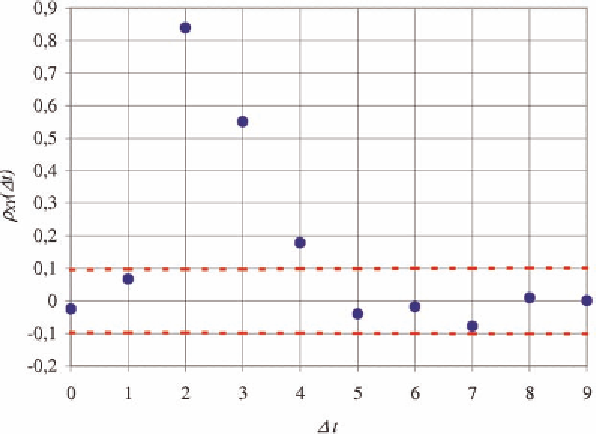
This approach is illustrated in Figure 1 for the following synthetically generated time series:
x
=
t
U
(0;1)
y
=
0.2
y
+
0.5
x
+
0.2
x
t
t
−
1
t
−
2
t
−
3
U
(0;1)
Where
(0;1
U
is a random variable uniformly distributed between zero and one.
As it is obvious from the above equations, the time series
y
t
of the independent variable
Y
incorporates
past values of the time series
x
t
with a time lag of two and three time periods, respectively. Therefore
the correct window of impact is [2,3].
Figure 1 shows the cross correlations computed from the artificial time series
x
t
and
y
t
for the time
lags ∆
t
= 0,...,9 as well as the bandwidth of their standard deviation which lies between the dotted lines.
The clear consequence which can be drawn from this correlogram is that the first significant correlation
Figure 1. Correlogram between two time series


Search WWH ::

Custom Search