Biology Reference
In-Depth Information
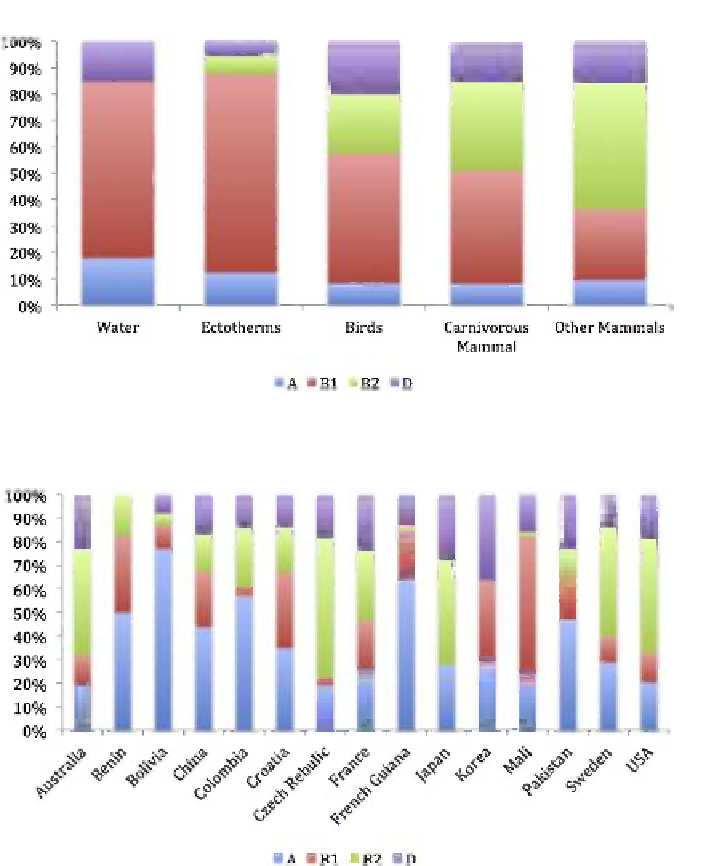
FIGURE 1.2
Relative abundance of the main
E. coli
phylo-groups (A, B1, B2, D) with respect
to the source of isolation.
Unpublished data and data taken from
Gordon and Cowling (2003)
, and
Power et al. (2005)
.
FIGURE 1.3
Relative abundance of the main
E. coli
phylo-groups (A, B1, B2, D) with respect
to the source of isolation.
Data taken from
Unno et al. (2009)
,
Tenaillon et al. (2010)
, and
Li et al.
(2010)
.
explain the very different relative abundances of the phylo-groups recovered
from humans living in different parts of the world.
Therefore, strains belonging to the different phylo-groups appear to have
different ecological niches and life-history characteristics. Phylo-group A and
B1 strains appear to be generalists able to occupy a broad range of vertebrate
hosts. By contrast, B2 and D strains are more commonly isolated from birds and
mammals than ectotherms. It has been argued that phylo-group B2 strains are
Search WWH ::

Custom Search