Database Reference
In-Depth Information
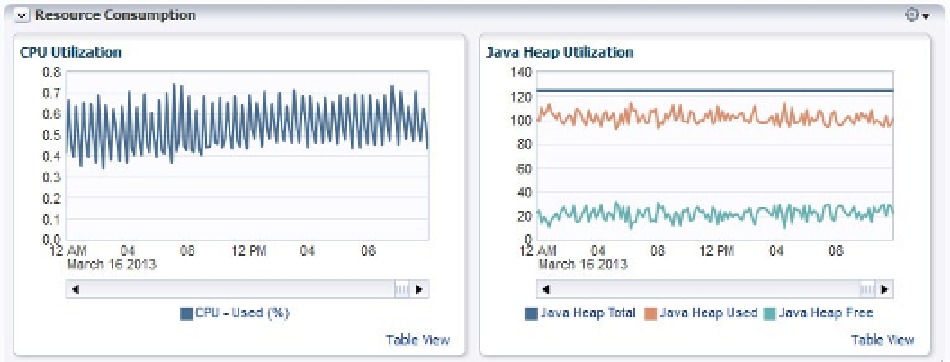
Figure 3-7.
The Resource Consumption region of the agent home page
Incidents region
: This displays the list of incidents recorded for the agent. (Incident
management is covered in more detail in Chapter 12, and so is not covered here.)
The other area of interest on the agent home page is the Agent menu, shown in Figure
3-8
. From here, the most
interesting selections you can drill into are as follows:
Monitoring
: This shows details of metrics, metric settings, metric collection errors,
status and alert history, and blackouts, as well as providing access to the Incident
Manager console.
Diagnostics
: This links into the Support Workbench to allow you to package details of
recent problems or incidents for uploading to My Oracle Support.
Control
: This provides the relevant links to shut down or restart the agent, or to end a
blackout.

