Database Reference
In-Depth Information
Usage Metrics
One metric is preset in the list: Job Dispatcher Processing Time (% of Last Hour). You can also add and configure
specific usage metrics to the environment. These are set up very similarly to the performance metrics and should be
tested thoroughly, based on the information gathered in the performance charts shown previously in Figure
11-28
.
The Usage Metrics area can be accessed by choosing Targets
➤
All Targets
➤
EM Jobs Service
➤
Metric
Configurations
➤
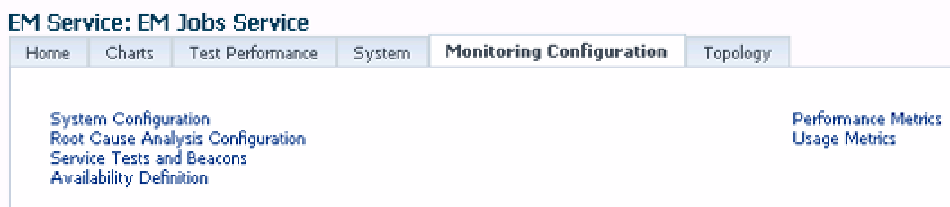
Usage Metrics. Alternatively, you can access these metrics via a link on the Monitoring
Configuration tab (see Figure
11-29
).
Figure 11-29.
The Usage Metrics option is located at the lower right area of the Monitoring Configuration tab
You can add, edit, or delete metrics from the Usage Metrics interface. In the following example, we will add
a systems usage metric by simply clicking the Add button and proceeding with the wizard. Figure
11-30
and
Figure
11-31
show different parts of the first wizard page.
Figure 11-30.
Adding a usage metric o check for NFS server mapping errors on a target host's unmonitored NFS server
Figure 11-31.
Choosing the correct system component settings for the configuration of the storage-free usage metric