Database Reference
In-Depth Information
EM Jobs Service Charts
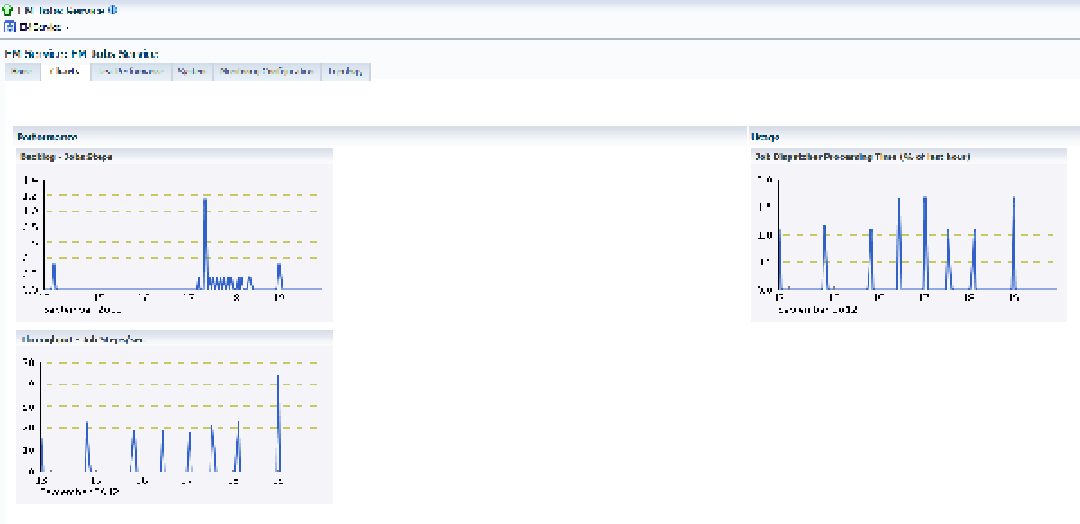
Making decisions on how many jobs are too many in a given time frame became much easier with the performance
charts in the EM12c EM Jobs Service. These charts are accessed through the Charts tab.
The EM Jobs Service charts show information regarding the performance of the job dispatcher, backlog of job
steps, and throughput (see Figure
11-28
). This graphical view of the data enables you to quickly ascertain whether
there is an issue with job performance in the EM12c environment.
Figure 11-28.
Three preconfigured EM job perfomance charts
You can create further monitoring enhancements for “job heavy” environments on the Monitoring Configuration
tab of the EM Jobs Service. You can then view this chart for heavy resource usage, as the data is broken down
effectively into three parts: Job Steps, Processing Time, and Throughput (Job Steps/Sec).
Performance Metrics
Performance metrics enable you to set up metrics specifically tied to a feature, in this case, EM jobs. The default
metrics are set for a standard database environment, leaving you to edit them in the existing interface if needed,
although that is rarely required. Two crucial metrics require only minimal configuration because of the uniqueness of
most database environments:
•
Throughput—Job Steps/Sec
•
Backlog—Jobs Steps
These two metrics, once configured for the value that is desired for the environment, will alert when the
throughput for a job is above the amount set per second or when the quantity of job steps backlogged is above
the threshold.