Database Reference
In-Depth Information
In the Alert Threshold section, choose the greater-than (>) comparison operator. Set the default thresholds for
warning and critical conditions to 70 and 90 percent, respectively. In the advanced options, you can edit the number
of occurrences before an alert as well create a custom message. You can also assign the metric to one of the predefined
categories which then enables EM12c Console to group your metrics with other similar metrics.
On the Credentials tab, leave Use Default Monitoring Credentials. Now you are ready to test your metric.
On the Test tab, add one or more databases (remember that you should have View privileges on them if you are
not a Super Administrator user). Then click the Run Test button. You should see the collection progress dialog box
appear for a short time (unless you selected many database instances), and the collection result is displayed. If you
have no error messages and the result is what you expected, you can proceed to completion on the Review tab.
If the metric extension was created successfully after you clicked the Finish button, you will see it on the Metric
Extensions home page with the status Editable. You can also see that this metric extension is version 1. Editing the
metric extension in Editable status will not increment the version. You can review and edit your metric multiple times,
until you get the collection working as you envisioned it in the real-time testing dialog box.
Testing the Metric Extension
If the first draft is working as expected, the next step is to perform test runs on the real targets. Before you can deploy
a metric on a target, the metric must be saved as a Deployable Draft. Select your metric and then, from the Actions
menu located above the table of metric extensions, choose Save as Deployable Draft. The metric's status changes
to Deployable Draft. At this stage, the metric is visible only to you, its owner, unless you explicitly grant permission
to other users or roles by using Actions
➤
Manage Access. Also note that you cannot edit a metric extension in
Deployable Draft status unless you create a new version, which you will do later.
To ensure that your metric extension behaves as expected, let's deploy it to some targets. This is done by choosing
Actions
➤
Deploy to Targets. After you select the targets and submit the deployment jobs, the metric extension will
be running in the background. All deployment jobs are asynchronous actions scheduled as jobs in EM12c. Metric
extension deployment on one or a few targets is usually pretty quick, so you can click the refresh icon in the
top-right corner, and if the job disappears from the list of pending deployments and doesn't show up in the list of
failed deployments in the second half of the screen, then deployment was successful. You can also see the deployment
progress from the Metric Extensions home page, which indicates the total count of pending and failed deployments,
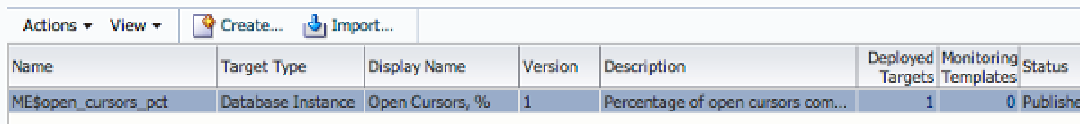
as well as the number of deployed targets for each metric extension in the library, as shown in Figure
10-4
.
Figure 10-4.
Metric Extensions home page showing deployment status
Now that the metric extension is deployed, you can use it just like any other out-of-the-box metric that came with
the Database Instance target type. After a few hours of collection, you might see data similar to that in Figure
10-5
.
To get to this screen, you navigate to the target where the metric is deployed and then from the target's menu choose
Oracle Database
➤
Monitoring
➤
All Metrics. Note that, unlike user-defined metrics, metric extensions do not have
their own view.