Database Reference
In-Depth Information
Clicking Run executes the ADDM comparison report. The report first indicates the commonality of the two
timelines (see Figure
9-55
).
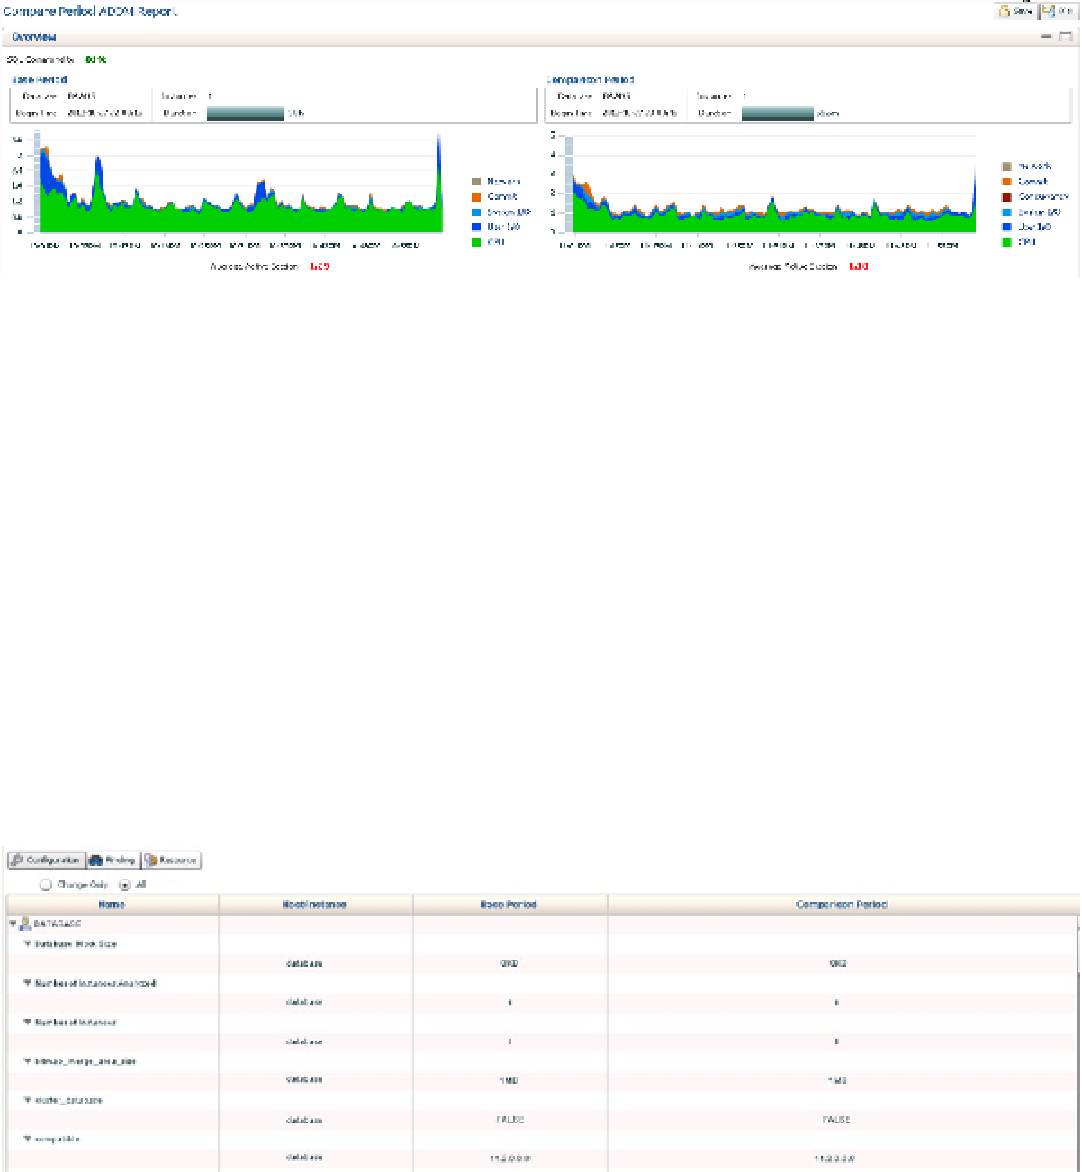
Figure 9-55.
An ADDM comparison report, comparing the previous hour with an hour of higher usage
Note that the duration of the comparison is for the entire 1-hour snapshot, even though time was entered for
a half hour. If snapshot intervals are set to occur more often than the default (1 hour), the ADDM comparison
will show results for the minimum number of snapshots required to cover the beginning and end time chosen.
Inspecting the left-hand values in the graph, you must note that the average sessions shown is not a one-to-one
representation between the graphs, but independent of each session to best demonstrate the data for each period used
in the comparison. Each period graph also contains its own legend for wait event types, to the right of each graph.
The bottom of each graph clearly shows the average active sessions, along with buttons at the top right to save or
e-mail the graphs in HTML format.
The Details pane in the bottom section of the ADDM comparison report is divided into three sections:
Configuration, Finding, and Resource.
Configuration
The Configuration section of the ADDM comparison report presents information regarding physical configurations,
parameter settings, and session parameters that may have impacted the difference in the periods compared
(see Figure
9-56
).
Figure 9-56.
The Configuration section of the ADDM comparison report, set to show All configuration values