Database Reference
In-Depth Information
Figure 9-38.
The lower pane of the Monitored SQL Executions Details report by the SQL Monitor for SQL_IDs involved
in the snapshot
The view can be adjusted to show SQL-specific metrics, as shown in Figure
9-39
, by simply clicking the Metrics
button in the upper-left corner. The data can be incredibly detailed and valuable when investigating an impacting
SQL statement.
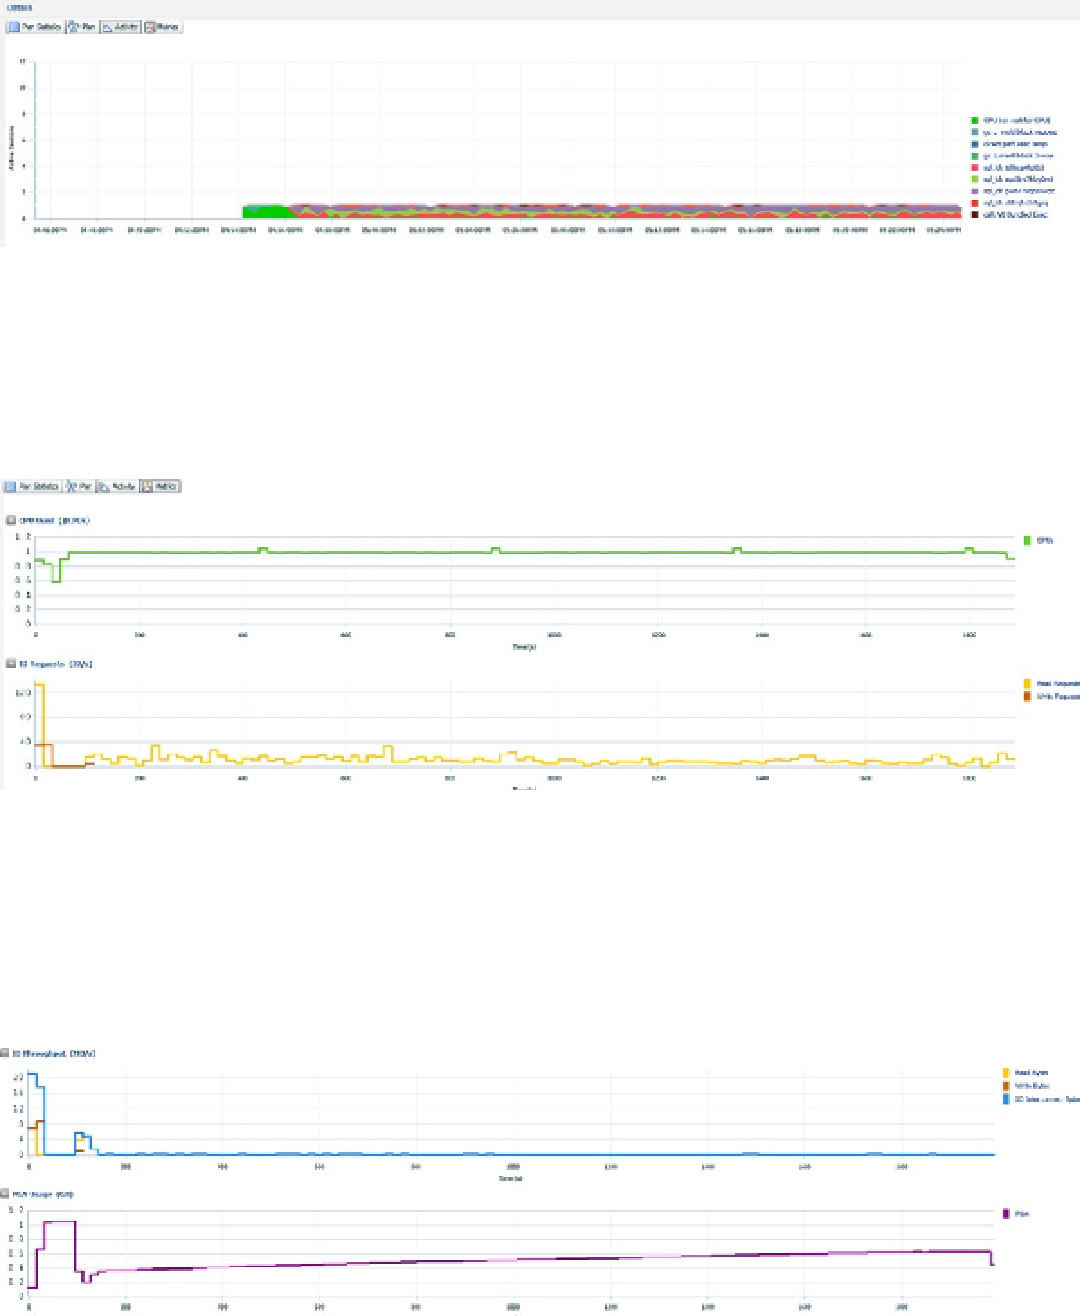
Figure 9-39.
Metric usage from the same report time as the SQL Monitor report in Figure
9-37
, indicating CPU and
I/O read and write requests in bytes
Whereas Figure
9-39
shows CPU and I/O read and write requests from the report, Figure
9-40
shows the results
of I/O throughput and PGA usage. This data shows the CPU usage and waits for CPU by the statement. By taking this
data and intersecting the high/low points, you can build a clear picture of how the read and write requests are affected
by CPU usage and CPU waits.
Figure 9-40.
SQL Monitor demonstrating I/O throughput by reads and writes in bytes