Database Reference
In-Depth Information
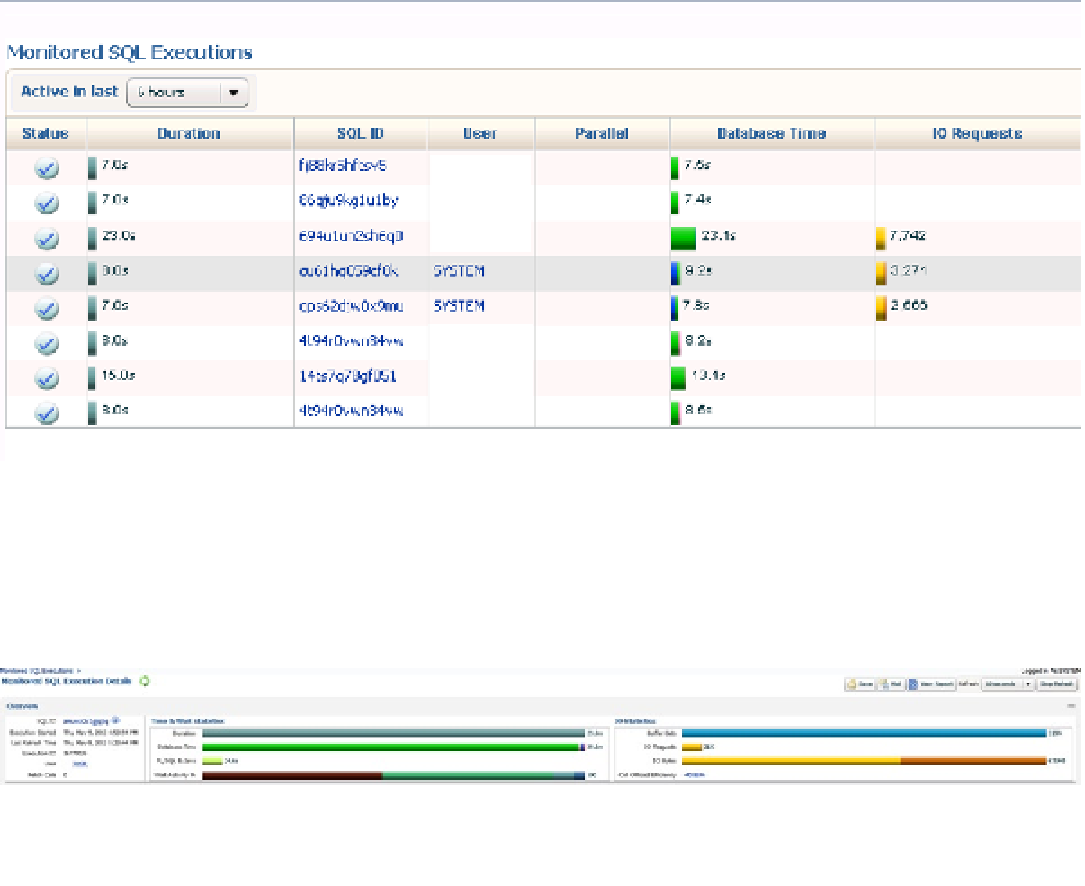
Figure 9-36.
SQL executing in the SQL Monitor
Data, ordered by active sessions displayed at the top, is followed by an active duration window, SQL ID, user info,
database time, I/O wait info, start time, end time, and SQL text in the main monitoring view, as shown in Figure
9-37
.
The page also offers links for SQL ID and user sessions to the Monitored Executions page.
Figure 9-37.
The top section of the SQL Monitor, the Monitored SQL Execution Details page
■
if there is one view that an administrator should consider giving view-only access to for monitoring activity
in a database environment, the sQl monitor is it. this view is exceptionally easy to use and offers incredibly valuable
information regarding activity and performance. the sQl monitor view offers quick access to alert the developer or
analyst when something may be amiss that would be less likely to escalate to an incident in the em12c, but may still
require an administrator's assistance. in the development lifecycle, this can offer members of the database team another
way to visually monitor what is occurring during both development and testing phases.
Tip
Whereas Top Activity and ASH Analytics share detail pages for SQL ID and user sessions, SQL Monitor shares
session details only with user sessions and CPU usage. For SQL ID, the SQL Monitor has its own performance page
data based on the execution of
DBMS_SQLTUNE.REPORT_SQL_MONITOR
by the EM12c console to populate the main SQL
Monitoring page.
Figure
9-38
is a graphical representation of this report as
report_level=>'ALL'
is executed by the EM12c
console. This same report can be executed using the package from the command line as well, but the EM12c SQL
Monitor interface conveniently populates and displays the data in a user-friendly format for the administrator.