Database Reference
In-Depth Information
Each of these options gives a unique view of waits and/or resource usage in the environment. You can choose the
combination that best suits the situation at hand and then view the data to investigate the issue.
You can choose the Top Level SQL ID, subsequently creating a very different view of the database performance,
and showing the percentage impact from the statement having that ID. See Figure
9-30
.
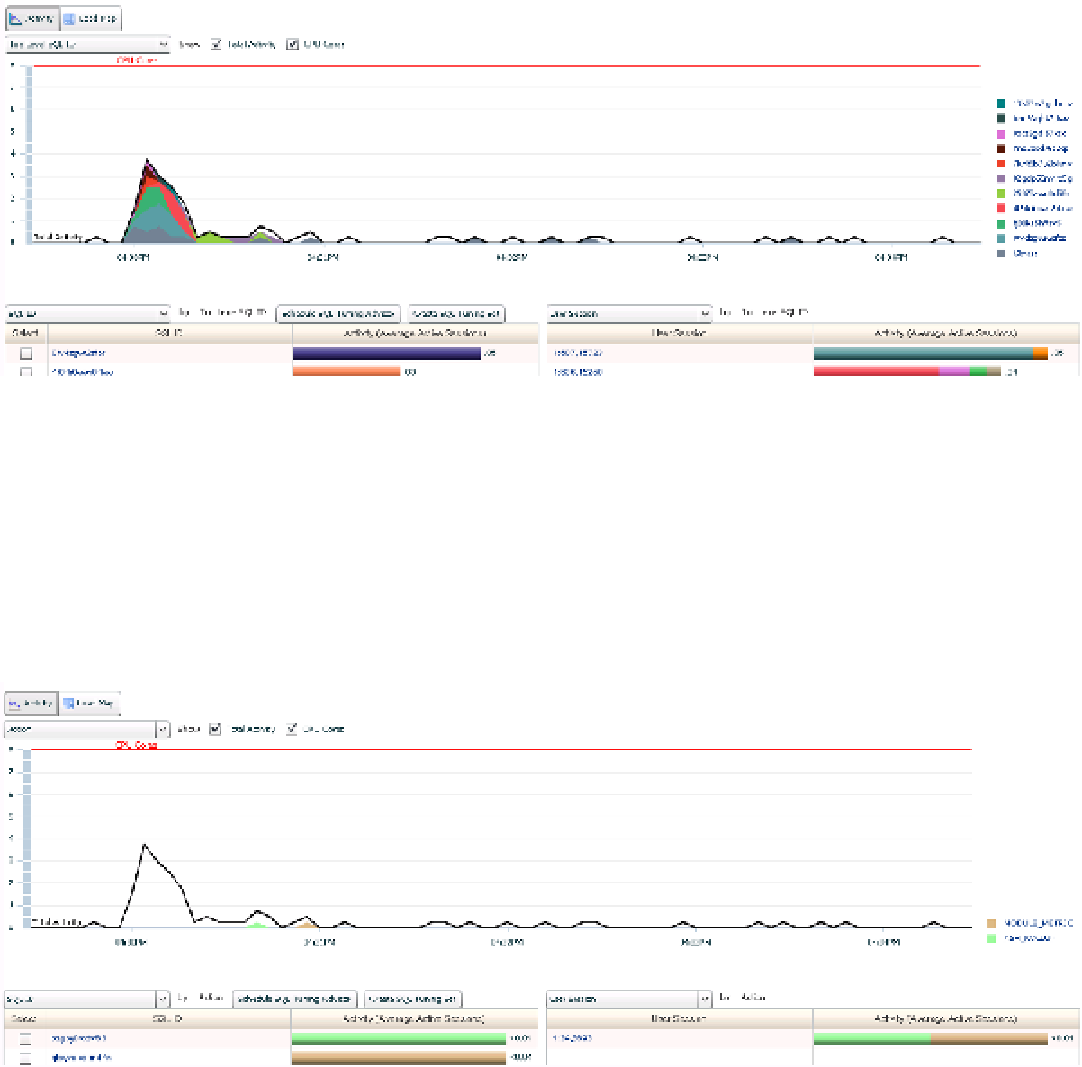
Figure 9-30.
Top-level SQL ID activity in ASH Analytics
The percentage of impact of SQL ID
cwu5p1yyp1p40
in Figure
9-30
is clearly demonstrated in the graph, which
shows that two user sessions were executing the statement throughout the timeline. This can be assumed by the
associated colors from the graph that identify the SQL ID and the user session, but also can be verified by clicking
each of the links to the user sessions, which will then show the SQL ID
okwk7211pw296
identified with each.
The example in Figure
9-31
still displays the overall total activity as a black line in the graph. The system response
time per call, which encompasses usage by two CPUs, also shows a small “blip” of activity when ASH data samples
are rolled up into the AWR.
Figure 9-31.
ASH Analytics, graphing by action, showing system response time, DB wait time and ASH roll-up