Database Reference
In-Depth Information
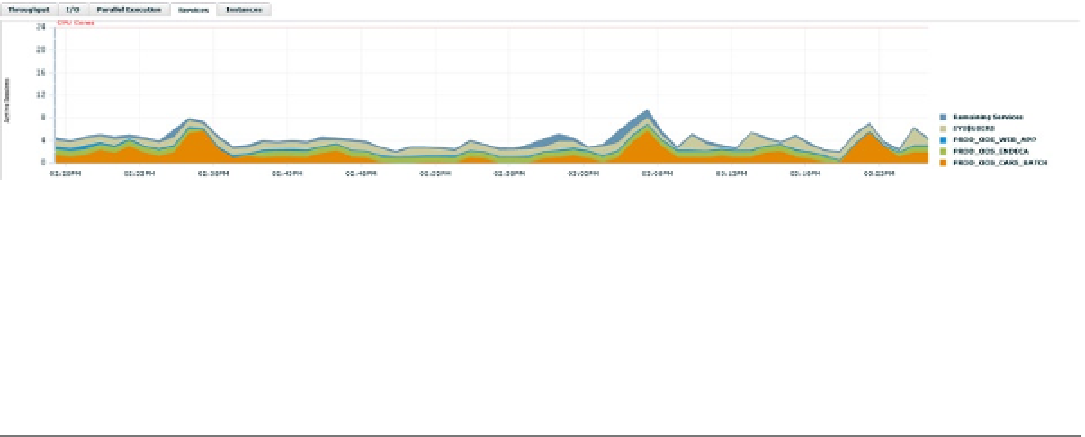
Figure 9-9.
Example of services and resource usage
Upon viewing the magnified legend, it is simple to see that the
App1_Prod_Orcl
service is utilizing the most
resources in the environment. The remaining services are quite similar in resource usage and in no way match the
sizeable impact of the application service.
This information can then be used to help isolate performance issues by service, helping to narrow down
optimization exercises.
■
the instances tab will show only if accessing a real application Cluster (raC) environment. Without this feature,
there is no reason for the tab and it won't show in the performance home page. all raC environments that were available
at the time of this writing involved release 2 exadata, and no actual instance information was shown in the interface.
this may be a bug in the current exadata release, or this tab may function in only non-exadata environments.
Note
Top Activity
The Top Activity page has been the cornerstone of the Enterprise Manager environment from its initial release.
Administrators could review the data displayed and have a graphical representation of the wait events in the
database—a simple view of database usage. From easily understood color descriptions for waits groups, an administrator
could often identify performance issues and pinpoint areas of concern without advanced knowledge of performance
optimization.
With the release of EM12c, the Top Activity page has been enhanced to offer more-definitive performance data,
simple interface options that tie in the Top Activity interface to the performance reports (such as ASH, AWR, and
advisor opportunities), and detailed session history.
The Top Activity page is the second choice in the Performance drop-down menu at the top left of the performance
page view (available once the administrator has logged in to a database target). The interface has remained greatly
unchanged since its initial appearance in Enterprise Manager 10g, so even those new to EM12c find the interface easy
to navigate.
The upper pane of the Top Activity page, shown in Figure
9-10
, provides a quick view of wait activity and active
sessions in the database environment. The legend to the right indicates what each color represents on the screen,
and a timeline is shown across the bottom.