Database Reference
In-Depth Information
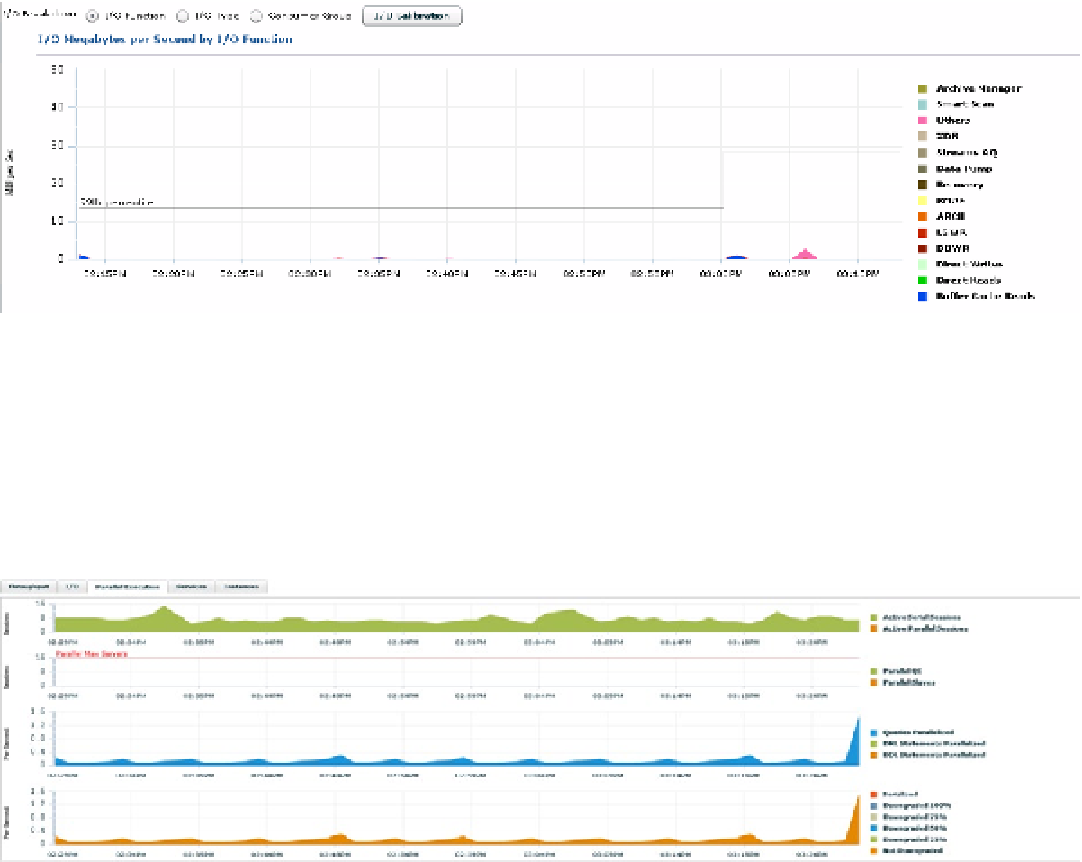
I/O
The I/O tab has graphs for I/O latency in milliseconds and I/O in megabytes per second by I/O Function, Type,
or Consumer Group (see Figure
9-7
). There is a button to take you through a graphical interface to quickly perform
I/O calibration (
DBMS_RESOURCE_MANAGER.CALIBRATE_IO
), needed if the database is going to utilize Auto DOP
(degree of parallelism).
Figure 9-7.
I/O in megabytes during a data pump operation from the performance home page
Parallel Execution
The Parallel Execution tab, shown in Figure
9-8
, shows pertinent information regarding active serial/parallel sessions.
In addition, a second graph shows the coordinator and slave sessions for each parallel execution, and a third graph
shows DDL, DML, and queries parallelized in the database environment.
Figure 9-8.
An example of parallel execution shown from the performance home, detailing parallel usage from
many levels
Services
If services are in use for the database environment, they will be available in the Services tab, shown in Figure
9-9
.
The data displays in a standard grid performance graph, identifying each service and its resource usage by color and
by name.