Database Reference
In-Depth Information
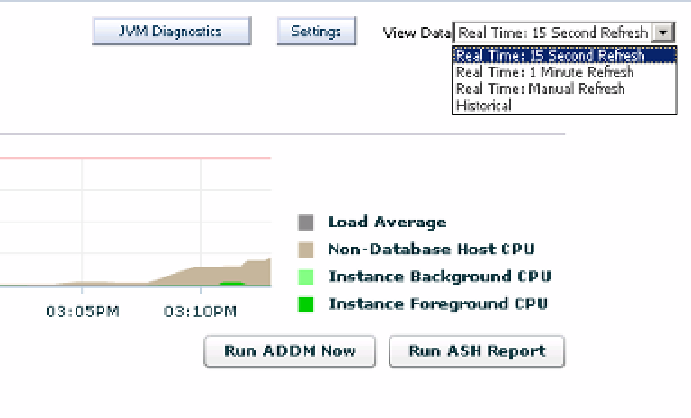
Figure 9-4.
CPU usage across a database server in an Oracle 11g environment, currently set to 15-second refresh
intervals, but demonstrating how to change to extended update intervals
The performance home, unlike the Top Activity performance page, is a summary of the database performance
and is not specific to database performance, but overall performance of the database environment, including host and
system info.
■
historical data from this section will be based on CpU data only. if you want more-specific data on database usage,
you must go to top activity. for less-aggregated data, refer to ash analytics, which is discussed later in this chapter.
Tip
The performance home grid data can be viewed and refreshed in 15-second intervals, 1-minute intervals,
or manually, or you can choose a historical view. Baselines can be included or excluded in the graph, along with load
averages. Options to run JVM Diagnostics, ADDM, or ASH reports are available from this section.
The main area is broken down into high-level database wait information. This view displays information about
not just CPU usage, but CPU usage outside the database and the system load average.
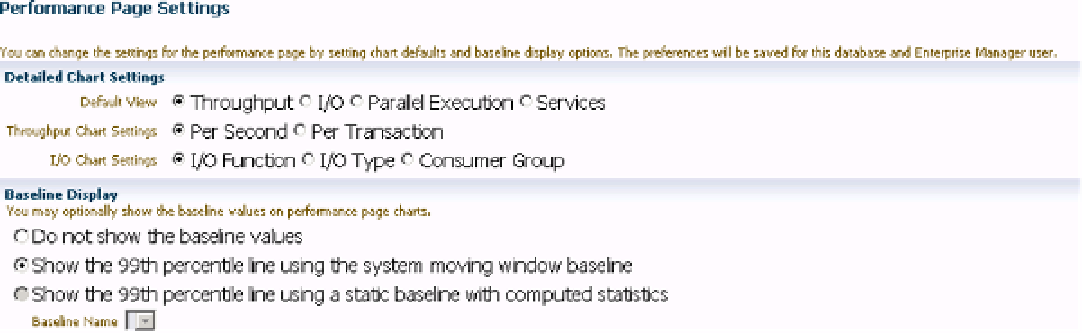
By clicking the Settings button, shown in the upper right of Figure
9-4
, you can change the chart default settings
from CPU based to display I/O chart information or baseline values (see Figure
9-5
).
Figure 9-5.
Changing the default performance home chart settings