Database Reference
In-Depth Information
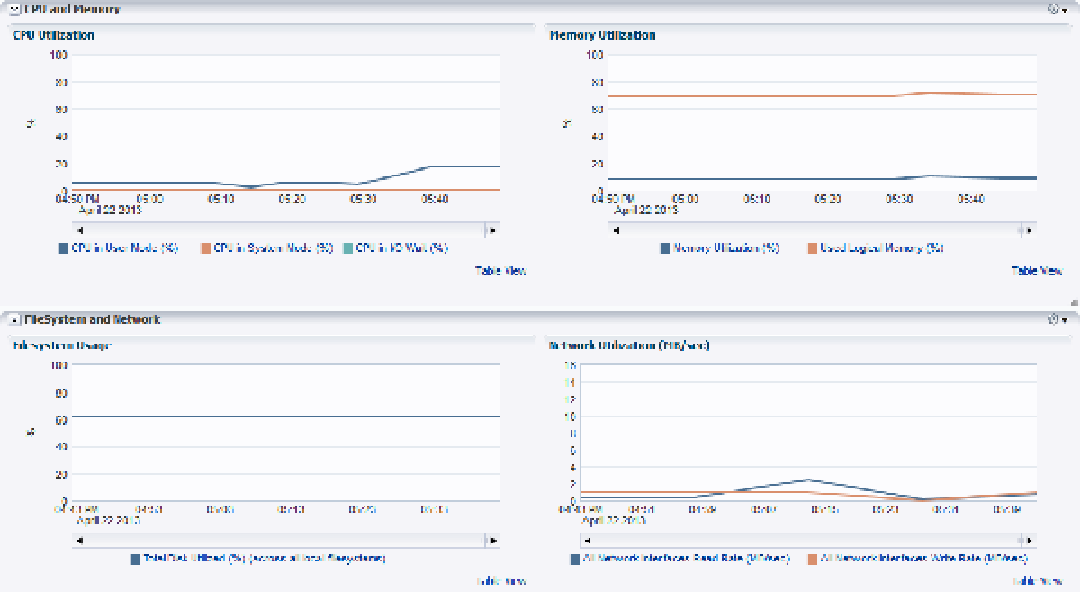
Figure 9-2.
Host performance information—note the spike in network utilization after 1:44 PM in the bottom-right
graph
In the left pane, you can view full summary information regarding the host status, incidents, configuration,
and job activity.
Any fluctuations in CPU usage and memory are displayed, along with filesystem usage and network utilization.
For each of the four areas (CPU, Memory, Filesystem, and Network), you can also view the data in a table format,
as shown in Figure
9-3
. To access this format, you click the Table View link at the bottom right of any graph.
The tabular representation can be inspected for out-of-the-ordinary values that may not show as clearly in a graphic
interface, or the data can be copied and pasted to a CSV or Microsoft Excel file.