Database Reference
In-Depth Information
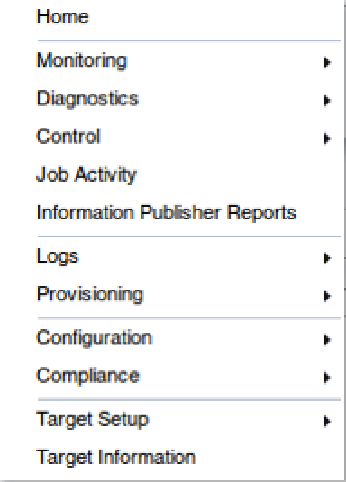
Figure 4-49.
The target type menu
Monitoring Setup
The Monitoring submenu contains at least the following items relating to metric collection and reporting:
User Defined Metrics
: User-created metrics for this target type
All Metrics
: All metrics for this target type
Metric Collection Settings
: Whether and how often to collect the metric
Metric Collection Errors
: Errors encountered when collecting metrics
Figure
4-50
shows the Monitoring submenu for a WebLogic server, illustrating these and WebLogic-specific
options. The use of these options is reasonably self-explanatory, while the actual metrics vary by target type. Figure
4-51
shows the result of selecting All Metrics for a database target. This gives you access to the full range of metrics available
for this target. We have sorted by category to make the list easier to view, because databases have a very large number of
potential metrics.