Biomedical Engineering Reference
In-Depth Information
a
b
100
2.5
t
0
= 0.1 days
t
0
= 1 day
t
0
= 10 days
2
1.5
50
1
0.5
0
0
0
1
2
3
4
0
1
2
3
4
time (weeks)
time (weeks)
c
d
0.15
0.2
0.15
0.1
0.1
0.05
0.05
0
0
0
1
2
3
4
0
1
2
3
4
time (weeks)
time (weeks)
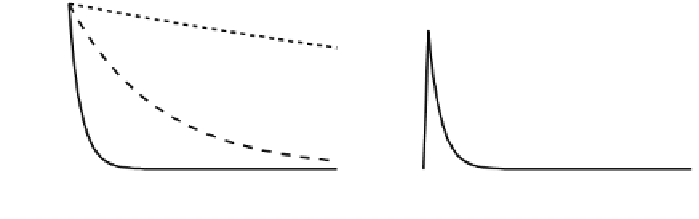
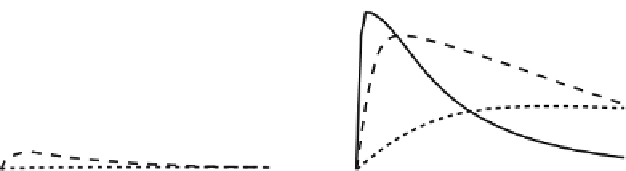
Fig. 3
Sensitivity analysis of the phase-change model in both layers to the characteristic solid-fluid
transfer time scale
t
0
. Temporal evolution of
a
the solid-phase drug concentration
c
e
;
b
the liquid-
phase drug concentration
c
0
;
c
the free drug concentration
c
1
;
d
the bound drug concentration
c
b
,
each averaged over the entirety of their respective layers
the considered period (Fig.
3
a). The slowest transfer time considered
t
0
=
10 days
causes only
75% of the drug to be unbound from the polymer (Fig.
3
a), leading to
negligible liquid phase concentrations in the coating. We observe that the (excess)
unbound concentration in the wall reaches significant levels only for the fastest solid-
liquid transfer time (with a peak mean concentration of
≈
≈
0.1) (Fig.
3
c). For
t
0
=
1
day, the peak mean concentration reaches about 1
/
5 of this value and is negligible
for the slowest transfer time.
The dynamics of the uptake of the drug into the bound state in the wall are strongly
coupled to the characteristic solid-fluid transfer time
t
0
in the coating (Fig.
3
d). For
the fastest
t
0
, a high mean concentration of slightly less than 0
1
day, implying that almost all receptors are occupied throughout the wall (compare to
c
max
b
.
2 is reached within
≈
2). With drug supply from the coating ceasing quickly, the retained con-
centration slowly decays over the next 4 weeks, reaching a mean concentration level
of less than 1
=
0
.
10 of the peak concentration at the end of the simulation. For slower
transfer times, the period to reach peak concentration is longer and the magnitude of
the peak concentration decreases. For
t
0
=
/
1 day, the peak concentration is reached
at
0.16. For the slowest
t
0
, it takes almost
3 weeks to reach the maximum mean concentration in the wall, and the mean peak
concentration is less than half of the peak concentration for
t
0
=
≈
5 days with an average concentration of
≈
0
.
1 days.
ʵ
0
has a qualitatively and quantita-
tively similar effect on the drug release as varying
t
0
(Fig.
4
). The porosity
Varying the porosity of the polymer coating
ʵ
0
enters