Biomedical Engineering Reference
In-Depth Information
Norm Modiolar Node: 10
Norm Modiolar Node: 8
Norm Modiolar Node: 7
0
0
0
−5
−5
−5
−10
−10
−10
−15
−15
−15
−20
−20
−20
−25
−25
−25
0
5
10
15
20
25
30
35
0
5
10
15
20
25
30
35
0
5
10
15
20
25
30
35
[mm]
[mm]
[mm]
Norm Midscalar Node: 10
Norm Midscalar Node: 8
Norm Midscalar Node: 7
0
0
0
−5
−5
−5
−10
−10
−10
−15
−15
−15
−20
−20
−20
−25
−25
−25
0
5
10
15
20
25
30
35
0
5
10
15
20
25
30
35
0
5
10
15
20
25
30
35
[mm]
[mm]
[mm]
Norm Lateral Node: 10
Norm Lateral Node: 8
Norm Lateral Node: 7
0
0
−4
−6
−5
−5
−8
−10
−10
−10
−12
−15
−14
−15
−16
−20
−18
−20
−20
−25
−22
−30
−25
−24
0
5
10
15
20
25
30
35
0
5
10
15
20
25
30
35
0
5
10
15
20
25
30
35
[mm]
[mm]
[mm]
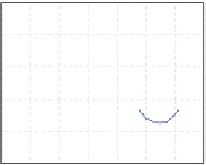
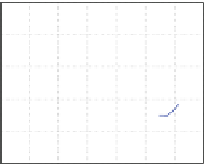
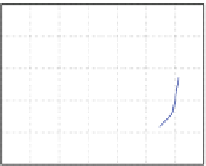
Fig. 7
Extracellular voltage at nodes 10, 8 and 7 when electrodes 1 to 16 are stimulated. For node
10 (no nerve degeneration) only small differences between electrode positions can be observed. For
node 8 (
medium degeneration
) differences can be observed. For node 7 (
large degeneration
)less
differences can be observed. Note that the graphs here presented have been normalized for each
electrode position (modiolar, midscalar and lateral). Each color represents a different electrode
being stimulated
Ta b l e 3
Spread of excitation width inmillimeters at different nodes for different electrode positions
Node 10 (mm)
Node 8 (mm)
Node 7 (mm)
Modiolar
2.25
1.55
2.2
Midscalar
1.30
2.1
3.05
Lateral
1
1.8
4.2
The model was also used to simulate the voltage decay at the spiral ganglion (for
nodes 10, 5 and 1) for different placements within the scala tympani for electrode 1
(the most basal one) as presented in Fig.
8
. The electrode was moved from a modiolar
position to a lateral position and the voltage was measured at the different nodes. As
expected, the placement of the electrode array closer to the modiolus (and therefore,
closer to the nerve) fibers, produces higher voltage through the spiral ganglion cells.