Chemistry Reference
In-Depth Information
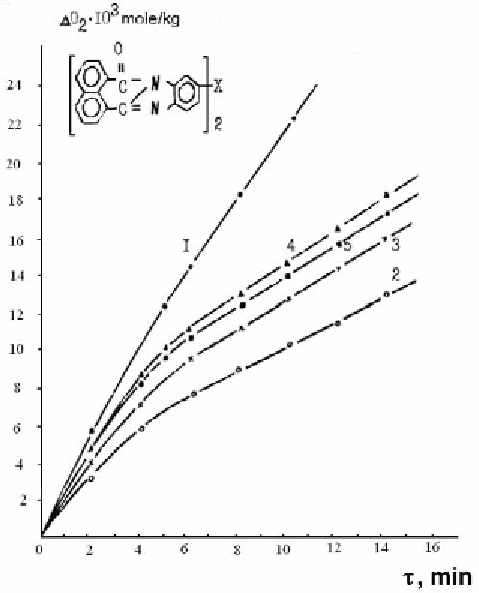
Figure 1.9. Kinetic curves of O
2
absorption by PCA samples: initial - (1), containing I mass % of bis -
aroilenbenzimidazole XLY -(2), XLIY-(3), XLIII-(4), XLYI-(5).
Obtained values of the rate of oxygen absorption in the process of PCA photooxidative
destruction are given in Table 9.
Table 9. Kinetics of oxygen absorption by dyed and undyed PCA fibres-derivatives of
bis-aroilenbenzimidazole
Polymer sample
Additive
concentration,
mass %
i φ
02
10×
Mole/kg
•
h
3
W
0
/W
ST
•
i φ
W
W
0
/W
ST
PCA - initial
-
2,03
-
-
-
PCA+additive XLIII
1,0
1,00
1,43
2,0
1,40
“-“ XLIV
1,0
0,96
1,32
2,1
1,59
“-“ XLVI
1,0
0,98
1,48
2,0
1,35
“-“ XLV
1,0
0,81
1,53
2,5
1,63
“-“
0,25
1,10
1,18
1,8
1,54
“-“
0,5
0,92
1,25
2,2
1,60
“-“
2,0
0,65
1,70
3,1
1,82
From the Table data it follows that all used compounds in one way or another possess
stabilizing activity. They decrease the rate of oxygen absorption by 2-3 times, moreover the


Search WWH ::

Custom Search