Database Reference
In-Depth Information
Once you have added all the performance counters, close the Add Counters dialog box by clicking OK. To save
the list of counters as an .
htm
file, right-click anywhere in the right frame of Performance Monitor and select the Save
Settings As menu item.
The
.htm
file lists all the performance counters that can be used as a base set of counters to create a counter
log or to view Performance Monitor graphs interactively for the same SQL Server machine. To use this list of counters
for other SQL Server machines, open the .
htm
file in an editor such as Notepad and replace all instances of
\\SQLServerMachineName
with nothing, just a blank string) .
A shortcut to all this is outlined by Erin Stellato in the article “Customizing the Default Counters for Performance
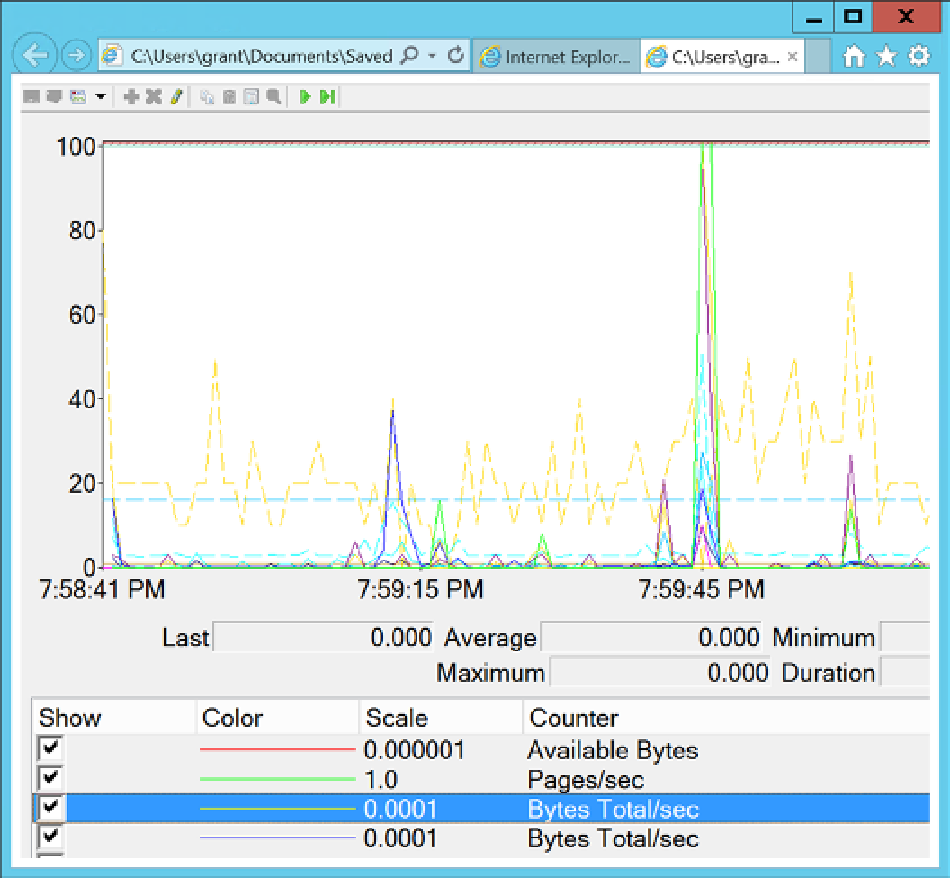
You can also use this counter list file to view Performance Monitor graphs interactively in an Internet browser,
as shown in Figure
5-2
.
Figure 5-2.
Performance Monitor in Internet browser