Database Reference
In-Depth Information
Multicolumn density graphs can come through multiple columns in the key of an index or from manually created
statistics. But, you'll never see a multicolumn density graph created by the automatic statistics creation process. Let's
look at a quick example. Here's a query that could easily generate a set of statistics with two columns:
SELECT p.Name,
p.Class
FROM Production.Product AS p
WHERE p.Color = 'Red' AND
p.DaysToManufacture > 15;
An index on the columns
p.Color
and
p.DaysToManufacture
would have a multicolumn density value. Before
running this, here's a query that will let you just look at the basic construction of statistics on a given table:
SELECT s.name,
s.auto_created,
s.user_created,
s.filter_definition,
sc.column_id,
c.name AS ColumnName
FROM sys.stats AS s
JOIN sys.stats_columns AS sc ON sc.stats_id = s.stats_id
AND sc.object_id = s.object_id
JOIN sys.columns AS c ON c.column_id = sc.column_id
AND c.object_id = s.object_id
WHERE s.object_id = OBJECT_ID('Production.Product');
Running this query against the
Production.Product
table results in Figure
12-20
.
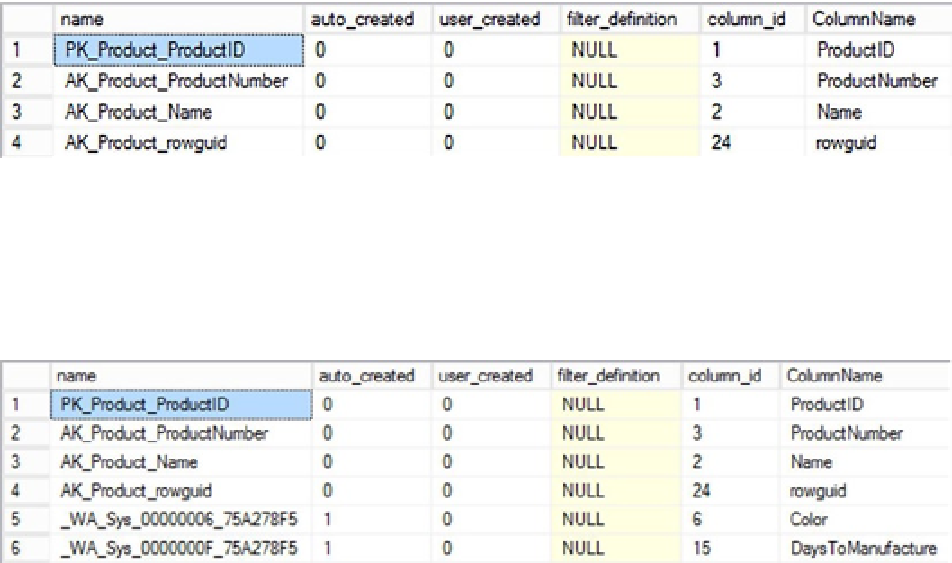
Figure 12-20.
List of statistics for the Product table
You can see the indexes on the table, and each one consists of a single column. Now I'll run the query that
could generate a multicolumn density graph. But, rather than trying to track down the statistics information through
SHOWSTATISTICS
, I'll just query the system tables again. The results are in Figure
12-21
.
Figure 12-21.
Two new statistics have been added to the Product table