Biology Reference
In-Depth Information
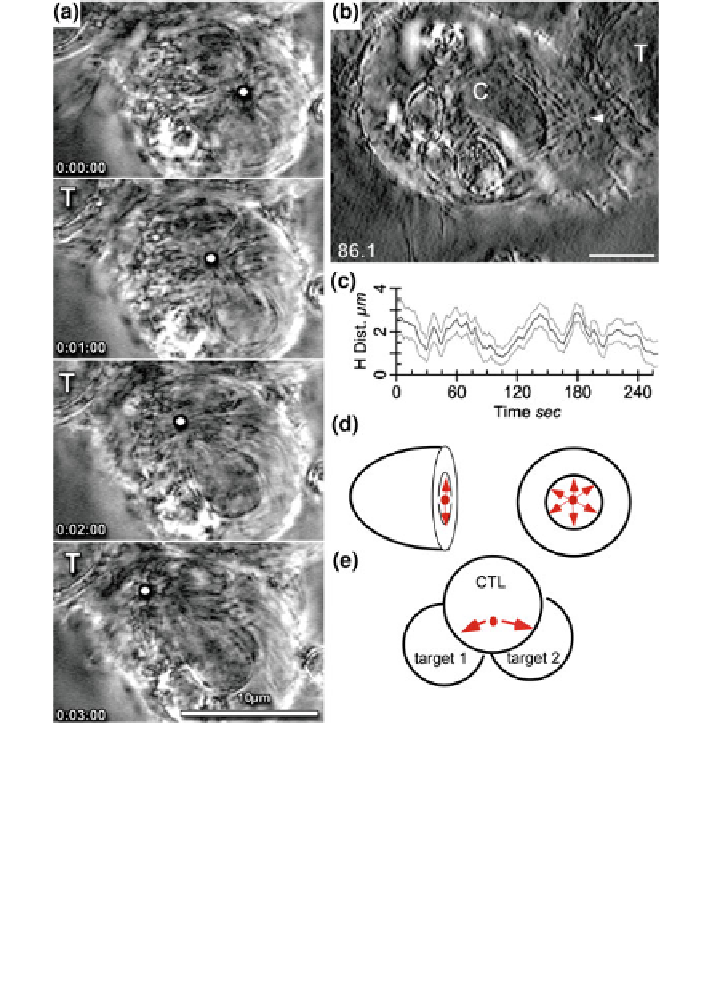
Fig. 21.2 Movement of the MTOC to the immunological synapse. a Modulated polarization
microscopy (MPM) images of a CTL bound to an EL4.BU target cell (T) showing that the MTOC
(white circle) translocated to the target contact site within 3 min. b MPM image showing a
polarized MTOC (arrowhead) in a CTL (C) bound to a target cell (T). The scale bar is 5 microns
wide. c The horizontal oscillations of the MTOC for the activated CTL in (b) are shown in
relation to the target contact site center. The mean horizontal distances are plotted versus time.
d Views of an activated T cell with the target cell removed. The MTOC (red) can oscillate in any
direction within the pSMAC ring. The right image shows the synapse face-on. (e) If a T cell
(middle) is activated by two target cells, the MTOC (red) can oscillate between the two target
contact sites. Figures a-c are reprinted from Immunity 16:1 Kuhn and Poenie Dynamic
polarization of the microtubule cytoskeleton during CTL-mediated killing. Copyright 2002 with
permission from Elsevier
One way to test that idea was to take advantage of cases mentioned earlier where there
are either partial LFA-1 rings or even just patches of LFA-1. When we compared the
distribution of microtubules and regions where LFA-1 was clustered, we only saw
microtubules in regions where LFA-1 was clustered. In activated T cells with partial