Environmental Engineering Reference
In-Depth Information
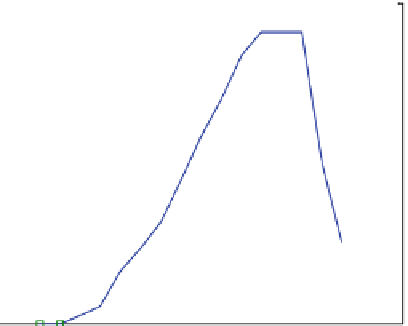
1.5 The Power Curve and the Performance Curve
However much the aerodynamicist is happy to use non-dimensional groups to
describe and analyse performance, the owner of the turbine is more interested in
the actual power output as function of wind speed. This is given by the power
curve. Figure
1.4
shows the power curve for the 7 m diameter Bergey BWC XL
10 kW turbine and Fig.
1.5
shows one for the 80 m diameter Vestas V80 2 MW
turbine. Both sets of data are given in Table
1.1
. Each figure indicates the ''cut-in''
wind speed below which no power is produced, approximately 3.5 m/s for both.
Also important is the ''rated'' wind speed where the advertised power is obtained;
13 m/s for the smaller machine and 15 m/s for the larger. It is common for the
rated speed to increase with turbine size because the tower height also increases,
and this increases the wind speed at the hub. Both turbines have a region, between
5 and 10 m/s, where the power increases rapidly, approximating the cubic
dependence of Eq.
1.1
. Because of the sensitivity of power to wind speed, it is
important to take note of the rated speed; the easiest way for a manufacturer to
''improve'' the performance of a turbine is to increase the rated speed! This
introductory description ignores several important issues in the complex process of
determining of the power curve. Some of these will be raised in
Sect. 1.7
. The
interested reader is referred to Measnet [
11
] for more information.
After 10 m/s, the power output of both turbines increases less rapidly as the
control system shifts away from attempting to maximise the power output. It is
important to be able to control a turbine at high wind, so that it does not extract
more power than can be absorbed by the generator. High power levels may also
cause unacceptable structural loads on the blades and other components. Small
wind turbine safety is considered in
Chaps. 8
,
9
, and
11
.
There are a number of possible control actions for large wind turbines, such as
controlling the angle of attack by pitching the blades, that are not available at small
Fig. 1.4 Power Curve for the
10 kW Bergey BWC Turbine
at Sea Level. Data from
www.retscreen.net
(accessed
4 Apr 2010)
11
10
9
8
7
6
Cut-in
wind speed
5
4
3
2
1
0
0
5
10
15
20
Wind speed (m/s)


Search WWH ::

Custom Search