Environmental Engineering Reference
In-Depth Information
these loads for extreme winds is covered in
Chap. 10
, and the corresponding loads
for raising and lowering, which can be larger, are considered in this chapter. Wind
turbines and monopole towers in particular, tend to generate large horizontal loads
in comparison to vertical loads on the foundation. This has lead to some specific
foundations, such as screw anchors, e.g. Serato and Victor [
3
]. An ''anchor'' is
designed to resist pullout rather than compression, so screw anchors are especially
appropriate for guyed towers at sites where it is difficult to deliver enough concrete
for conventional foundations. IEEE Std 691-2001 also gives information on screw
anchors.
12.2 Site Assessment
A common and obvious site requirement for a small wind turbine is that it be
sufficiently windy to provide the power required by the load and/or to make a profit
for the owner by feeding electricity to the grid. It has been pointed out a number of
times that small wind turbines for remote power are usually sited next to, or near,
the load they are supplying. Of necessity, a grid-tied small turbine may also be
placed close to the owner's house. The only choice left may well be the tower
height.
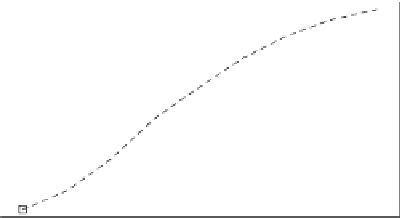
To demonstrate the importance of seeking the windiest possible site, Fig.
12.1
shows the monthly energy output of a Skystream 2.4 kW turbine as a function of
average wind speed. Note that the dependence of average power output on average
wind speed is closer to linear than the cubic relationship between instantaneous
power and wind speed. There are two main reasons for this: first the wind speed is
itself distributed over a wide range as demonstrated in Fig.
1.8
. Second, the leveling
off of the power curve towards the rated wind speed reduces the production at high
wind speed, especially for the lower rated speeds of small turbines when compared
to large ones. As a rule of thumb, an average hub height wind speed of 5 m/s can be
regarded as a good value, so a daily output of 24 kWh is ''good'' for the Skystream.
If the wind speed were reduced to 4 m/s, Fig.
12.1
shows a halving of the
output, whereas an increase to 6 m/s increases output by 50%. These changes are
Fig. 12.1 Monthly output
for the Skystream 2.4 kW
wind turbine. Solid line
shows linear approximation
as explained in the text
800
600
400
performance data
133(U-2.75)
200
0
2
4
6
8
10
Average wind speed (m/s)


Search WWH ::

Custom Search