Environmental Engineering Reference
In-Depth Information
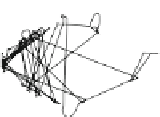
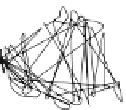
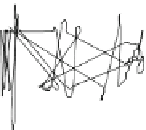
Fig. 8.11 Yaw rate as a function of wind speed and rotor speed, 97 h of data [
21
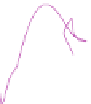
]. The pink data
indicate the turbine is furling. The dashed curves on the right hand give the safety limit on yaw
rate explained in the text
between x
n
and U
wake
in Eqs.
8.5a
and
8.9a
. However, it is also possible that
changes in wind direction decrease in magnitude as wind speed increases and this
decrease takes over from the natural frequency in setting the maximum yaw rate at
around 10 m/s. However, it has been observed that the peak yaw rates for a given
wind speed are typically associated with yaw angles in excess of 408, outside the
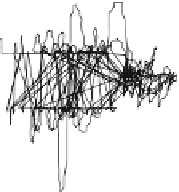
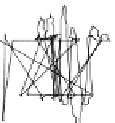
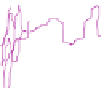
range of validity of the theories presented in this chapter. Figure
8.12
is an
example of such a high-yaw-rate event, in which a large increase in wind speed
follows a change in wind direction. The turbine does not initially respond to the
change in wind direction possibly because of the low wind speed. As the wind
speed increases, high yaw rates occur during the subsequent realignment of the
turbine. At time just after 6 s, the yaw rate exceeds the IEC stipulated maximum.
Fortunately, the rotor speed remains low during this high yaw rate, so the gyro-
scopic loads are not excessive. The dashed lines in the right side of Fig.
8.11
indicate the IEC limits of rotor speed and yaw rate given by Eqs.
9.6
and
9.14b
of
the next chapter which are based on (
8.1
). If the limits are exceeded, then the
actual gyroscopic moment exceeds that stipulated in the standard. This turbine
appears to be performing safely but further tests showed that reducing the moment
of inertia of the turbine about the yaw axis caused higher yaw rates.
8.7 Aerodynamic Over-speed Protection
There are two main ways of enabling over-speed protection through the action of
aerodynamic forces, namely furling of the tail fin and pitching. They are now
considered in turn.


Search WWH ::

Custom Search