Environmental Engineering Reference
In-Depth Information
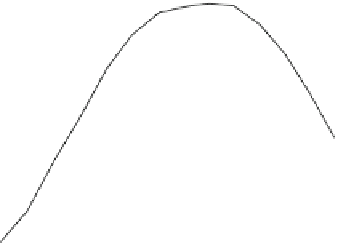
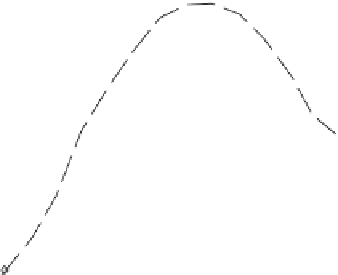
Fig. 5.10 Lift:drag ratio for
the SD7062 aerofoil
80
Re = 1x10
5
Re = 2x10
5
Re = 3x10
5
Re = 4x10
5
60
40
20
0
-10
-5
0
5
10
15
Angle of attack (degrees)
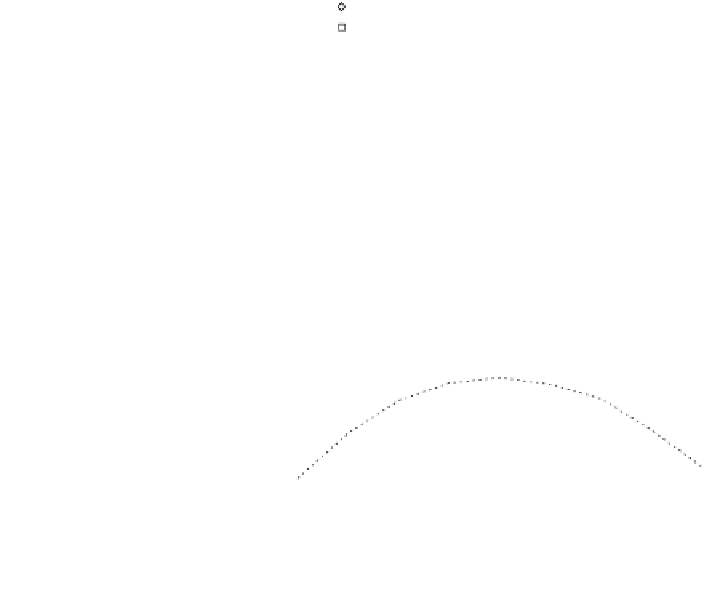
Fig. 5.11 Predicted effect of
changing the aerofoil on the
power and thrust coefficients
for the measurements of
Anderson et al. [
5
]. Open
symbols show twice C
P
,
closed symbols show C
T
1
0.8
0.6
N
ACA 4412
SD 7062
0.4
6
7
8
9
10
11
12
13
14
Tip speed ratio,
λ
NACA 4412. The computed power and thrust coefficients are compared in
Fig.
5.11
to the computed results for the NAC 4412 section from Fig.
5.2
.As
expected, there is a modest improvement in C
P
that reflects the increase in the
lift:drag ratio for the SD7062 compared to the NACA 4412.
5.5 Maximising Power Extraction
In preparation for the more complete study in
Chap. 7
, the optimising of blade
performance is now considered in terms of maximising C
P
. Recall from
Chap. 2
that the Betz-Joukowsky limit requires C
P
B 16/27 = 0.593 for unshrouded tur-
bines, and from
Chap. 1
, that the high-Re blade of the large Vestas V47 has
C
P
& 0.5 (when allowance is made for mechanical and electrical inefficiencies).
Furthermore, it is known that a finite N, and a finite l/d, reduce the maximum C
P
from the Betz-Joukowsky limit. Thus it would appear that a maximum C
P
of just


Search WWH ::

Custom Search