Environmental Engineering Reference
In-Depth Information
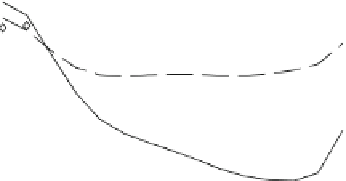
Fig. 5.3 Predicted velocity
through the rotor for the
measurements of Anderson
et al. [
5
]
0.8
0.75
0.7
0.65
= 8
= 10
= 12
0.6
0.55
0
0.2
0.4
0.6
0.8
1
radius, r/R
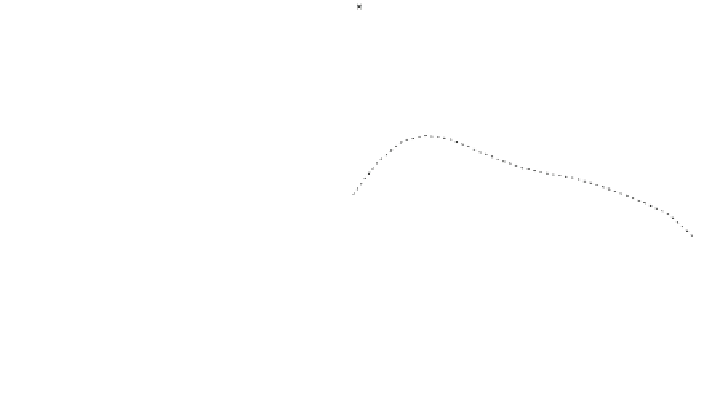
Fig. 5.4 Predicted blade
circulation for the
measurements of Anderson
et al. [
5
]
0.28
0.26
0.24
0.22
= 8
= 10
= 12
0.2
0.18
0.16
0
0.2
0.4
0.6
0.8
1
radius, r/R
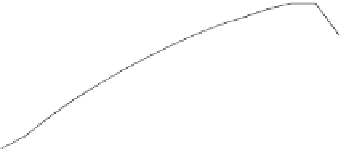
Fig. 5.5 Predicted
distribution of blade torque
for the measurements of
Anderson et al. [
5
]
5
4
λ
= 8
= 10
λ
= 12
λ
3
2
1
0
0
0.2
0.4
0.6
0.8
1
radius, r/R
thrust. Unfortunately the maximum measured value of C
T
in Fig.
5.2
b is just over
unity, so it was not possible to explore the accuracy of the calculations in the high
thrust region; there just does not appear to be any good data for these conditions.


Search WWH ::

Custom Search