Environmental Engineering Reference
In-Depth Information
Protein
Water
Carb.
Lipid
1.0
0.5
Extr.
NA
0.0
Si
A. HIGH−SI CELL
2000
1000
3000
Wavenumber (cm
−1
)
4
K
Ca
P
S CI
Mg
2
0
B. LOW−SI CELL
-2
-4
-6
-4
-3
-2
-1
0
1
2
3
Principal component 1
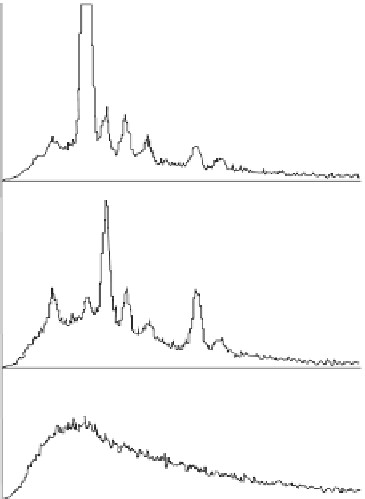
Figure 2.20
FTIR resolution of phytoplankton popu-
lations.Top:FTIRspectrumfromsinglecolonyof
Micro-
cystis
. The absorption bands are derived from differ-
ent radicals or molecular groups in water, lipid, protein,
nucleic acid (NA) and carbohydrate (Carb) within algal
biomass. One band (Extr.) is derived from extraneous
(atmospheric) CO
2
. Bottom: Principal Component Anal-
ysis(PCA)loadingplot,separatingspectraof
Microcystis
(m) and
Ceratium
(c) into two separate clusters. PCA was
carried out on all spectra (
n
= 40) for the spectral region
1750-900 cm
−1
. Adapted from Dean
et al.
, 2007.
C. FILTER MEMBRANE
2
4
5
1
3
X-ray energy (keV)
Figure 2.21
High-Si and low-Si subpopulations in a
colony of
Microcystis.
Top: Scanning electron micro-
graph of carbon-coated, freeze-dried colony of
Micro-
cystis
. Bottom: X-ray emission spectra from single cells
of
Microcystis
with high (A) and low (B) above sam-
ple levels of Si. The control spectrum (C) from a clear
area of filter membrane next to cell A does not have any
elemental peaks. Sigee and Levado, 2000.
differences between the two algae in relation to
protein and carbohydrate levels (Dean
etal
., 2007).
Resolution of species sub-populations. Multivari-
ate analysis can also be applied to single-species
samples and has the potential to demonstrate


Search WWH ::

Custom Search