Environmental Engineering Reference
In-Depth Information
otrophic indicator species (Table 3.4b). Heinonen
(1980), for example, studied the occurrence of
algae in a range of Finnish lakes, listing about
100 species indicating eutrophy and 25 indi-
cating oligotrophy. Species were classified as
eutrophic indicators when their occurrence in
eutrophic/oligotrophic waters was
0
1980
1960
5
10
1845
15
1700
2. The cor-
responding ratio for oligotrophic indicators was
0.7. The trophic state of lakes was calculated as
the ratio of eutrophic/oligotrophic species counts
or as biovolumes. Index values
>
20
25
1500
8 indicated olig-
otrophicconditionsinthecaseofthespeciescount,
and
<
0.1
0.2
0.3
0.4
0.5
0.6
0.7
A/C Ratio
<
35 for the biovolume ratio.
More complex indices
. These are based on quanti-
tative rating of individual indicator species. Bret-
tum (1989) developed a system in which 150 algal
species were scored on their proportion of total
biomass for various classes of environmental vari-
able (pH, total P content, total N content, N/P ratio,
etc.). A final trophic index could then be con-
structed for individual trophic levels from ultra-
oligotrophy to hypertrophy.
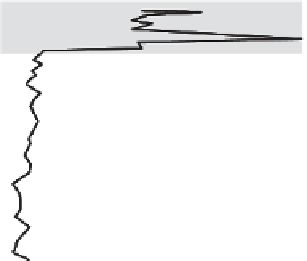
Figure 3.6
Changes in the ratio of araphid pennate
to centric diatoms (A/C ratio) as an indicator of grad-
ual eutrophication in Lake Tahoe (USA). The dramatic
increase in the A/C ratio during the late 1950s is associ-
ated with increasing human population around the lake.
Taken from Sigee, 2004, adapted and redrawn from
Byron and Eloranta, 1984.
Eloranta (1984) on the sediments of Lake Tahoe
(USA) showed a clear change in the diatom com-
munity during the late 1950s (Fig. 3.6), consis-
tent with eutrophication. The increase in A/C ratio
(
Organic pollution
0.7 to 0.7) at this time was related to increases
in the indicator species
Fragilaria crotonensis
and
Synedra
spp. (with decreases in
Cyclotella ocel-
lata
and
Melosira
spp.), and occurred at a time
of increasing human population around the lake.
Inferences of eutrophication from the fossil record
(diatom A/C ratio) are confirmed by contemporary
lake measurements carried out from 1959 to 1990
(Carney et al., 1994) - showing an increase in pri-
mary productivity (annual rise of 5.6%), decrease
in Secchi depth and an increase in available nitro-
gen (as NO
3
).
Indices based on indicator species.
Improvements
in sampling procedure, recording the full spec-
trum of species sizes, led to quantitative informa-
tion being obtained on all planktonic algae and the
development of indices based on separate indicator
species rather than taxonomic groups.
The most direct indices are based simply on
the recorded presence of eutrophic and olig-
<
According to Palmer (1969), organic pollution tends
to influence the algal flora more than many other
factors in the aquatic environment such as water
hardness, trophic status, light intensity, pH, DO (dis-
solved oxygen), rate of flow, size of water body and
other types of pollutants. Organicpollutionresembles
trophic status (previous section) in relating to nutrient
availability, but differs in being soluble organic rather
than inorganic nutrients. The terms oligo-, meso- and
eutrophic are used specifically for inorganic nutrients
and not for soluble organics (Table 3.2).
Palmer (1969) carried out an extensive literature
survey to assess the tolerance of algal species to
organic pollution, and to incorporate the data into an
organic pollution index for rating water quality. Algal
genera and species were listed separately in order of
their pollution tolerance (Table 3.5), and included a
wide range of taxa (euglenoids, blue-greens, green
algae and diatoms) as well as planktonic and benthic
forms. The assessment of genera was determined as


Search WWH ::

Custom Search