Geography Reference
In-Depth Information
In-Depth
Dasymetric Mapping
John K. Wright developed this technique for mapping that merges geographic
representation and cartographic representation. Recognizing that choropleth
maps fail to distinguish between subareas of an aggregation unit (e.g., urban
and rural areas in counties), they will show amount of grain grown per hectare
for urban areas where no corn or wheat is grown, and show average number of
people in a family for rural areas where no people live.
Wright's solution subdivided the aggregation unit into subareas that were
assigned weights based on associations between the land-use type of that sub-
area and the property to be mapped. The weights add up to 1 for the entire
aggregation unit.
The dasymetric technique is a far more accurate way of representing GI
than choropleth maps and can be relatively easily done using GIS overlay oper-
ations and some calculations. See Plate 11 for an example of the difference
between a choropleth and a dasymetric representation.
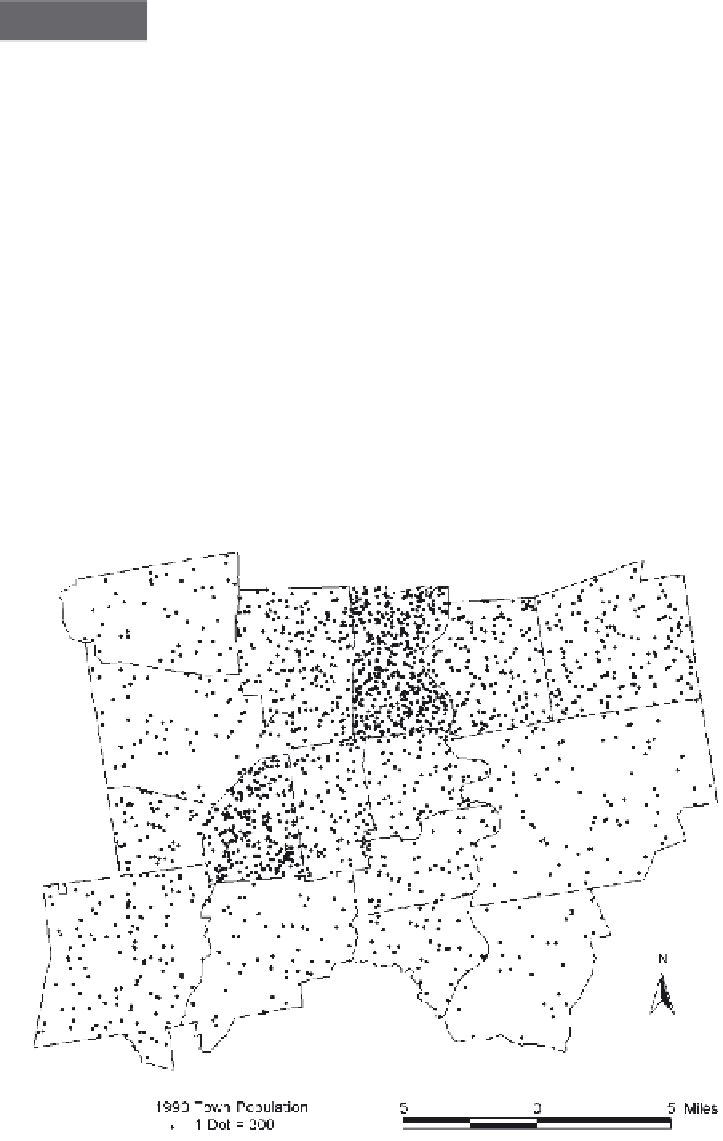
A dot-density map of population density.
From Cromley & McLafferty (2002). Reprinted by permission of Guilford Publications.


Search WWH ::

Custom Search