Biomedical Engineering Reference
In-Depth Information
Table 1. Case study data statistics
B
(m)
H
(m)
U
(m/s)
u
* (m/ s) B /H
U
/
u
*
K
(m2/s)
Max
711.2
19.94
1.74
0.553
156.5
19.63 5.05
2.54
892.0
1.9
Min
11.9
0.22
0.03
0.002
13.8
1.29
2.62
1.08
83.0
1.70
0.54
0.088
51.7
7.62
3.79
1.39
107.7
62.9
1.31
0.49
0.084
51.4
7.13
3.79
1.37
98.4
127.6
2.55
0.66
0.097
52.4
8.72
3 .77
1.42
128.4
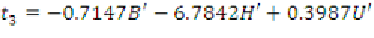
(12)
(16)
Since the activation function in the output
neuron is a linear function, we also get
(13)
where
B'
,
H'
and
U'
are scaled variables according
to equation (7) and Table 1. Also, we have
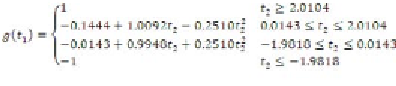
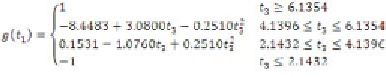
(17)
Thus, regression rules are extracted from the
trained MLP. Among these 64 (4
3
) potential rules,
some are null and will never execute. Null rules
can be identified using the Simplex algorithm
(Tsaih & Chih-Chung, 2004), which is not within
the scope of the present work. However, rules
fired for the training and test data are listed in
Table 4, in which the number under the function
name denotes the corresponding sub-function.
(14)
(15)
Table 2. GA parameters and CPU speeds/time
N
e
(/ chromosome)
CPU Speed
(GHz)
N
g
CPU Time (s)
Case
N
p
17830.33
1
200
101
100
3.20
31772.62
2
200
101
50
2.66
33600.17
3
400
101
100
3.20
4
200
201
20
2.66
45690.86
39280.16
5
200
201
100
3.20


Search WWH ::

Custom Search