Biomedical Engineering Reference
In-Depth Information
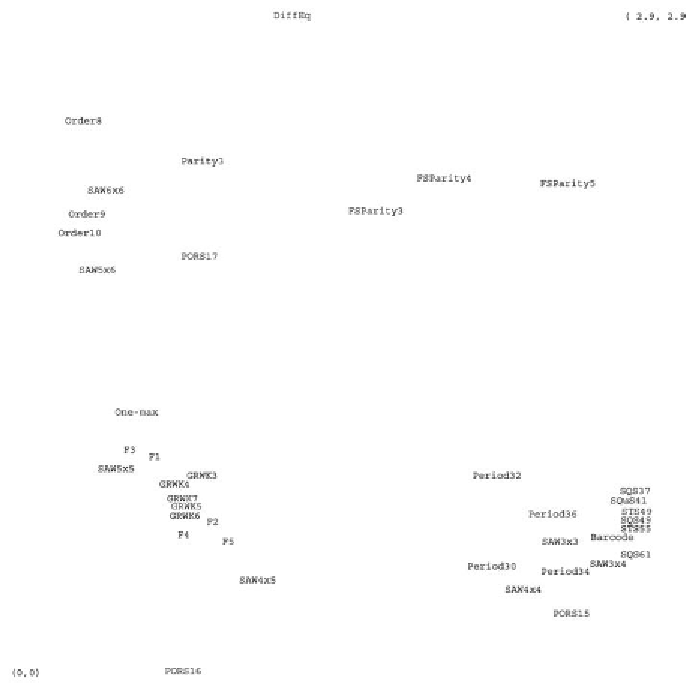
Figure 5. A nonlinear projection in two dimensions of the problem distance in 15 dimensions. The actual
position of a problem on the diagram is the beginning of the string representing its name. The points
at the corner give the scale of the projection.
more complicated fitness landscape, a graph that
preserves a moderate amount of diversity has so
far given the best compromise between the two
fitness function.
it is possible to winnow the graph set to remove
graphs that have performance characteristics
similar to others in the set. This is offset by the
addition of other graphs that are found to perform
better than the existing graphs for problems that
have been examined. In this way, a taxonomy
of graphs can also be developed in a fashion
similar to the problems that have been studied so
far. Using this co-evolving strategy aids in the
understanding of underlying similarities between
evolutionary algorithms. In addition, it allows
for the evaluation of the graph set to improve
how well this method works on problems yet to
be analyzed.
FUTURE TRENDS
Given that the number of available graphs increas-
es exponentially as population size increases, there
are a nearly limitless number of graphs available
for use in GBEAs. Many of the graphs used in
the current graph set are commonly found graph
structures or derivations from those simple graphs.
As data is compared from different problems sets,
Search WWH ::

Custom Search