Biomedical Engineering Reference
In-Depth Information
•
It manages the user log on procedure, by
checking account data of users stored on
the database;
area. Notice that the other areas, i.e. the “Home”
area and the areas that give access to informa-
tion concerning documents and involved people,
is available to all users and does not need a log
on procedure.
Once in the simulation area, the user can choose
whether to run a new simulation or visualize
the results of one or more simulations executed
previously. If a simulation started in a previous
session is still running, the user can also monitor
its execution.
Before running a new simulation, the user
accesses a Web form in which he/she can set
the duration of the simulation and the values
of network and simulation parameters, and can
choose the name of the results file, as shown in
Figure 7. For each parameter, the user can accept
the default value or decide to change and set it
within a given range. For example, the default
number of classes is 5, but values between 3 and
12 are admitted.
While the simulation proceeds, the user can
visualize, at run time, the values related to the
different performance indices, by means of plots
built by the Gnuplot software. As an example,
Figure 8 shows a snapshot of the SO-Grid inter-
face, in which the user can observe the trend of
the overall entropy, plotted versus time. Whenever
he/she wants, the user can decide to stop a running
•
It manages the user choice of simulation
parameters, and creates the correspondent
configuration file, which is passed as input
to the simulator;
•
It interacts with the simulator to start and stop
simulations on behalf of users, and updates
related information on the database;
•
It accesses the file repository to retrieve
simulation results and show them to users,
according to their preferences, through the
graphical interface;
•
When requested by a user, it builds a Gnuplot
file for the comparison of results related to
different simulation runs, and passes it to
the graphical interface.
SO-Grid GUI
The portal front-end provides the user GUI
through which users can operate on the portal,
execute simulations and visualize results. In this
section, we show some of the GUI Web forms,
in order to illustrate how the portal can be actu-
ally used.
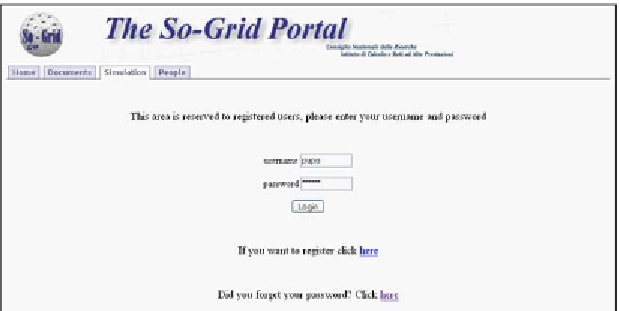
Figure 6 depicts the login form that is presented
to users when they want to enter the simulation
Figure 6. SO-Grid graphical interface: the login page

Search WWH ::

Custom Search