Biomedical Engineering Reference
In-Depth Information
Equation (2).
Template-related differences
+
0.01* center
−
centroid
+
10
−
4
* Number of sections
Length Vertical Bar
occurred during the cycles 10 and 12. The changes
match their shape and cycle with those of the 5
length structure and occur at the even cycles, so
the structure seems to have learned this growing
pattern until reaching the expected size.
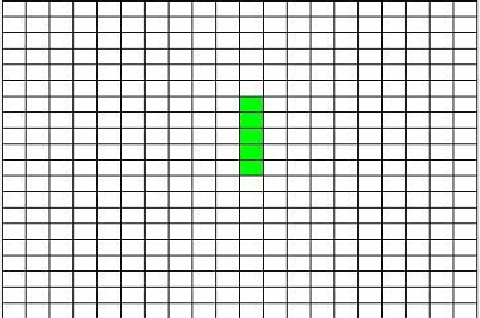
The second test consisted in developing a 7 cells
vertical bar from the GA population of the 5 cells
vertical bar.
We obtained the same genes, but this time the
percentages and the gene order were changed, as
can be seen in Table 2. This test seems to indicate
that the resulting genes function as the previous
ones, although they are not located in the same
position.
Figure 9 shows the development of the structure
and the final status with an error of 0.0305. The
changes, besides the structure growth from 5 to
7 until its stabilisation for the remaining cycles,
Length Vertical Bar
Finally, we tried to grow a 15 elements vertical
bar from the GA population of the 5 elements
vertical bar. Although the result was correct,
the solution has certain peculiarities: the growth
of this structure created a lateral side that was
supported by the superior edge and completed
the remaining bar with some elements that are
downwards generated. In this case, the genes that
played the role of the work regulating clock signal
were mixed with the growth generating genes.
This test concluded that genes explanation is not
always easy: at the same time that they express
their own behaviour (see gene 2 at Table 3), they
can be linked with the expression of other genes.
The genes that provide the solution are those of
Table 3, where the error committed is 0.0305.
Table 1. Genes for the growth of a 5 elements
vertical bar
N
Pmtr
Act
Cons
Seq
Special
1
1
.9771E-7 t
rue
0100
2
0000
45.2033
false
1010
Grown N
3
1000
3.8838 f
alse
0101
Figure 8. Final stable structure of the tissue


Search WWH ::

Custom Search